macOS 15+
Swift 6
MIT License
POIROT
Investigating your Claude Code sessions.
No login. No tracking. No analytics. No BYOK. No extra cost. Works offline. Less than 6 MB.

Investigating your Claude Code sessions.
No login. No tracking. No analytics. No BYOK. No extra cost. Works offline. Less than 6 MB.
Poirot was vibe-coded in a weekend. The entire app — architecture, parser, UI, tests — was built in a single creative burst with Claude Code as the co-pilot. What started as "I wonder if I can build a companion app for Claude Code… using Claude Code" turned into a real, usable tool.
Named after Hercule Poirot, Agatha Christie's legendary detective. Because every great investigation needs the right tools — and Poirot helps you investigate exactly what your AI assistant has been up to.
A quick walkthrough of what Poirot can do.
Everything you need to understand what Claude Code did — and why.
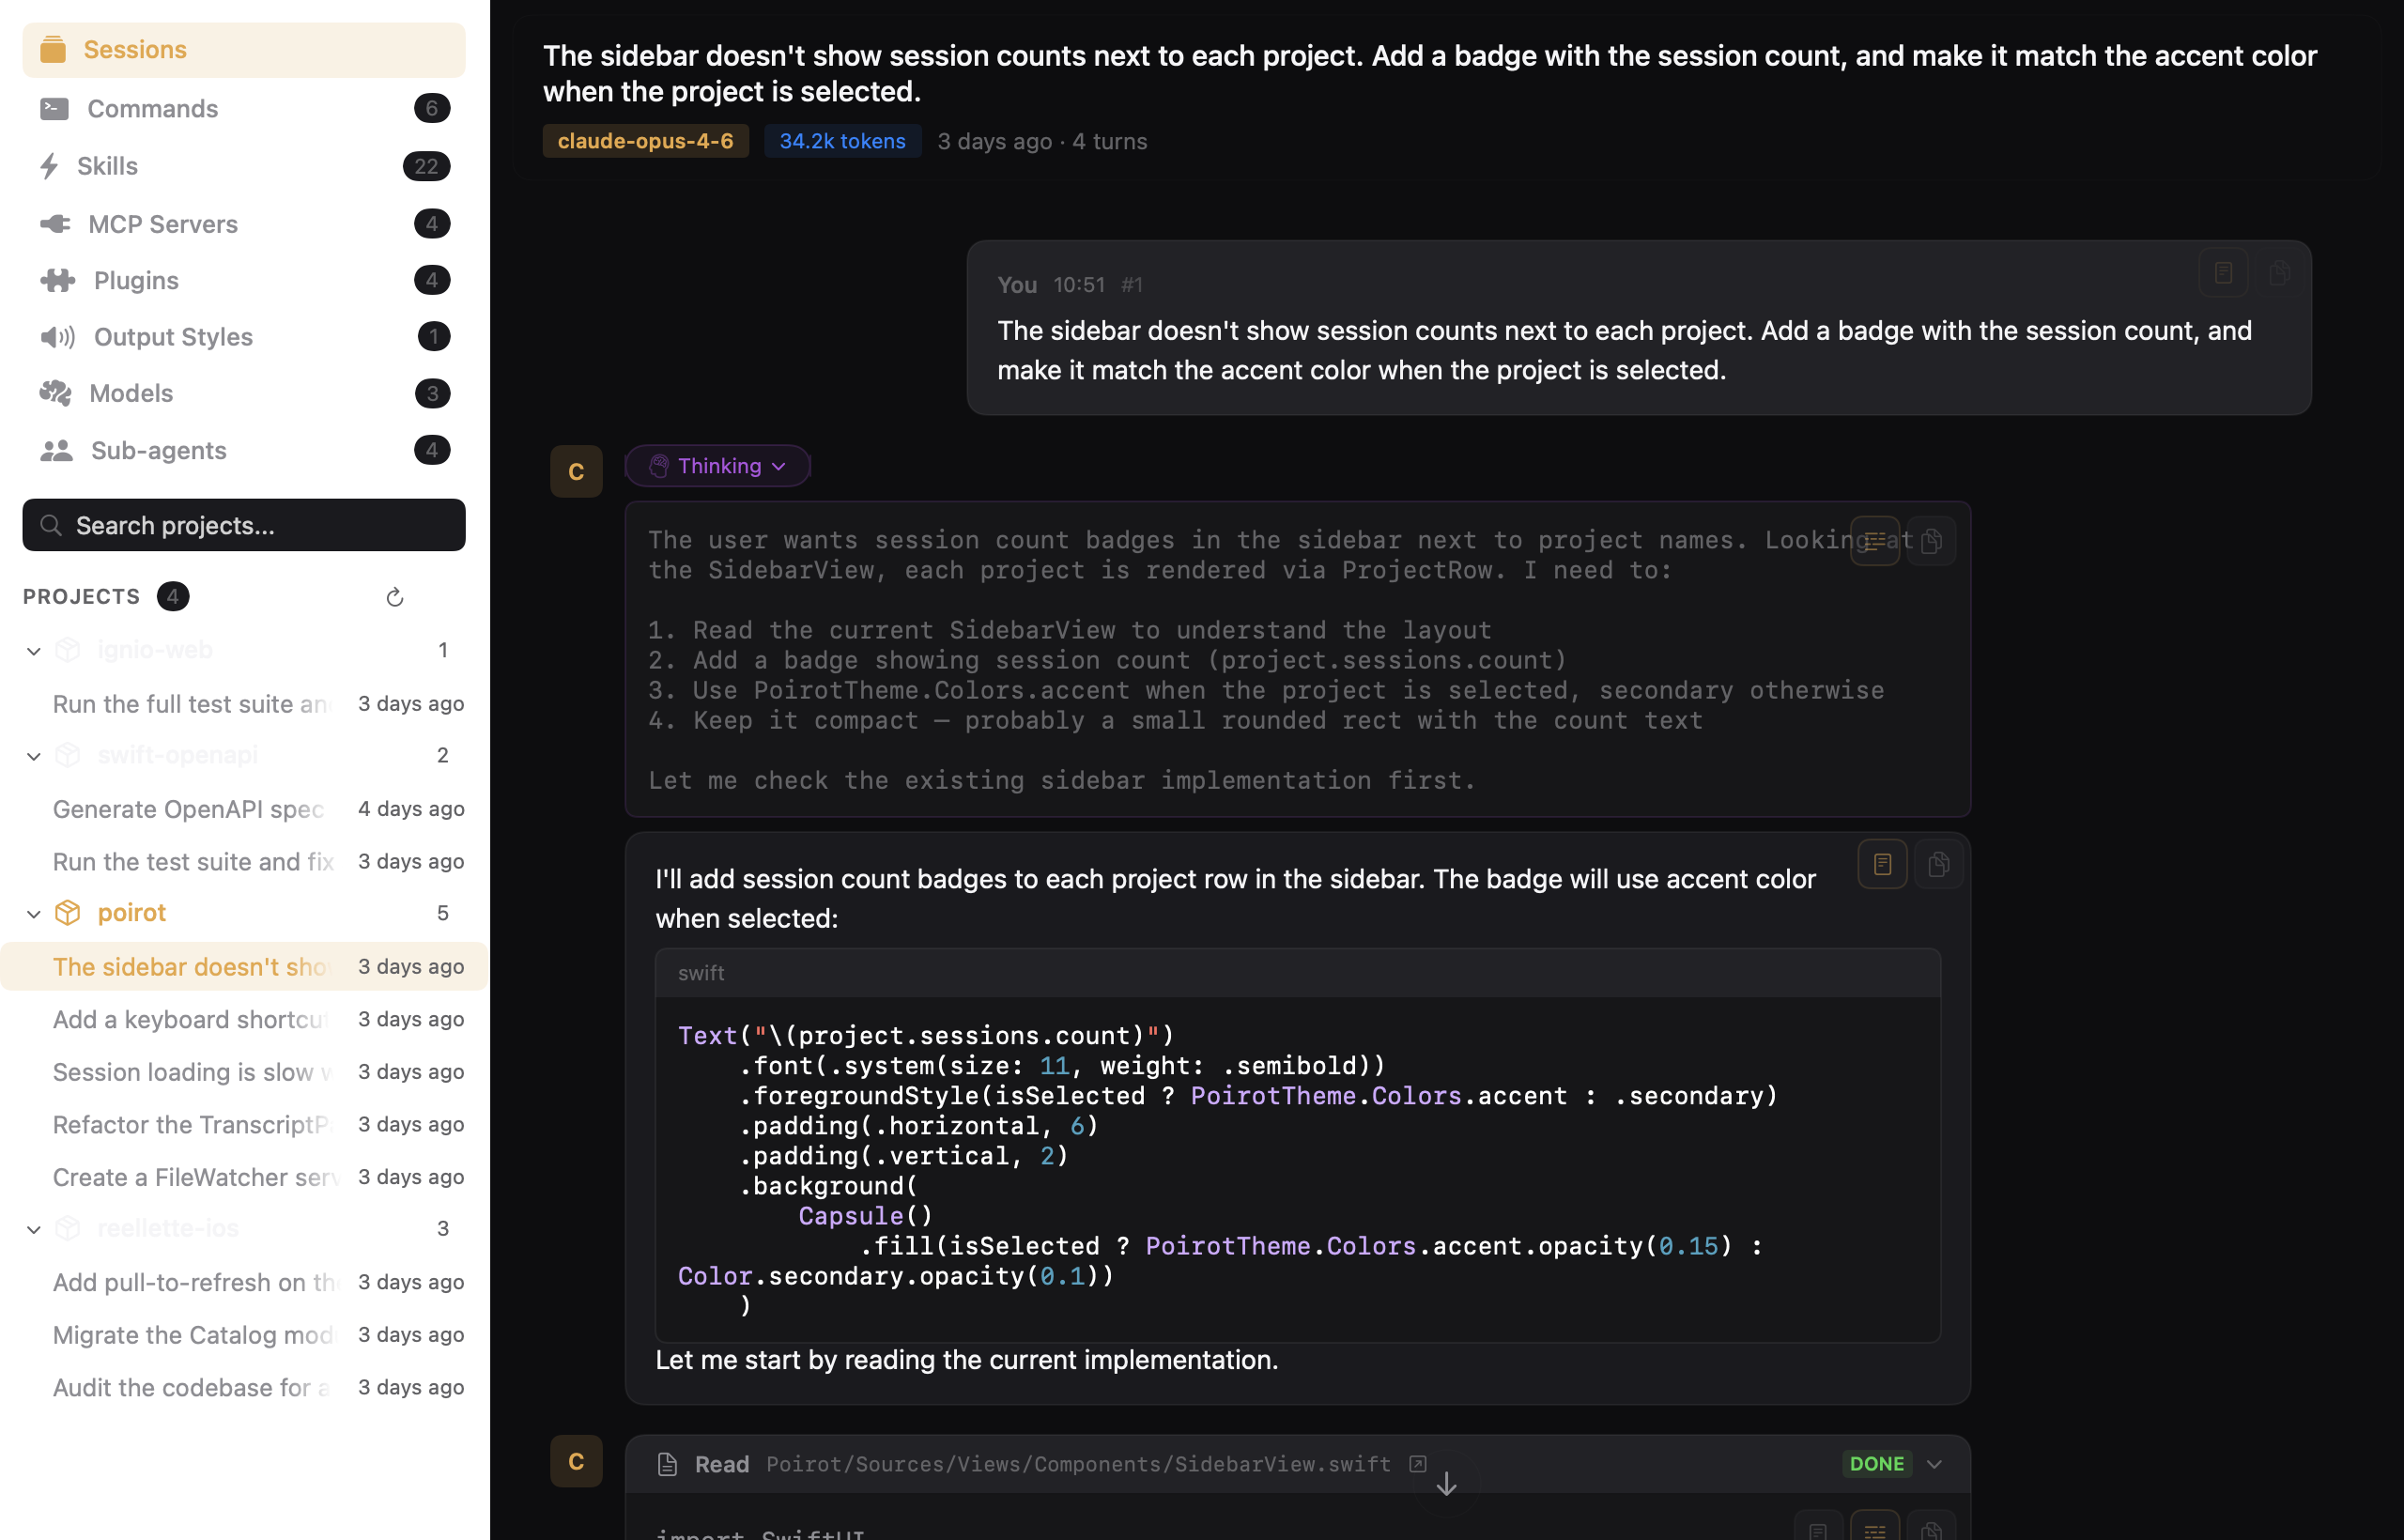
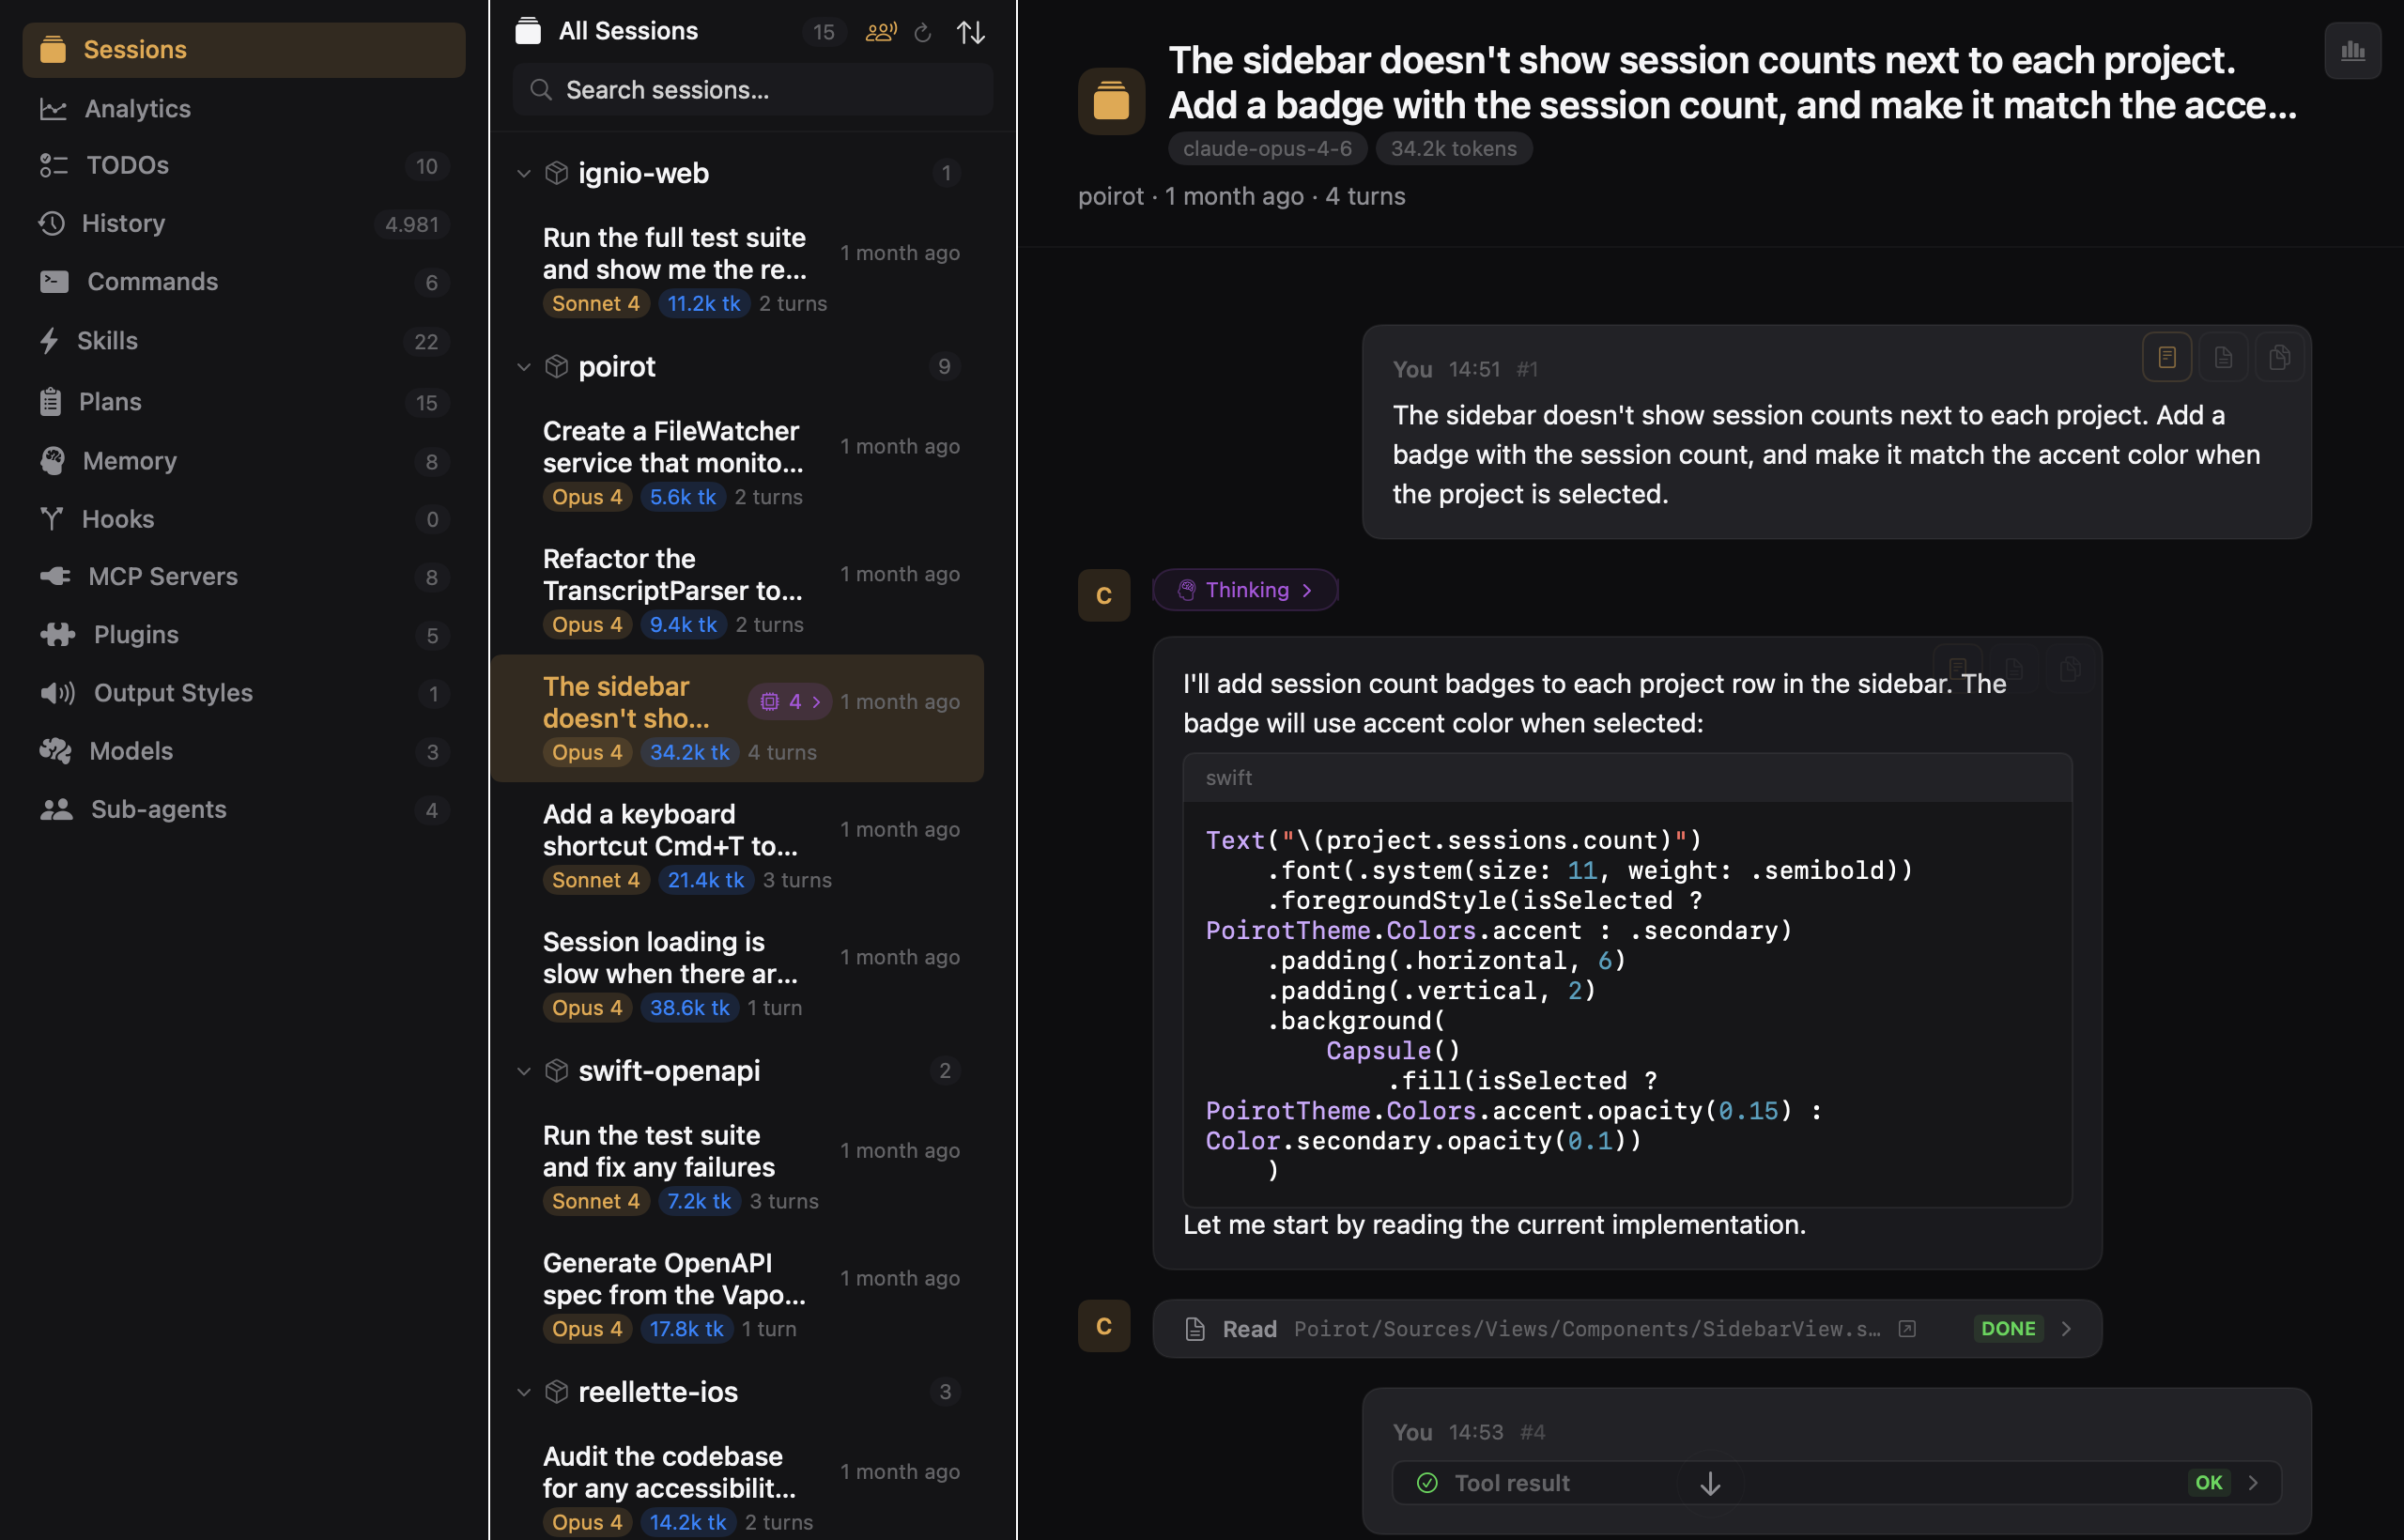
Browse all your Claude Code sessions grouped by project in a dedicated sessions tab. Timestamps, token counts, model info — everything at a glance with search, sort, and agent session filtering.
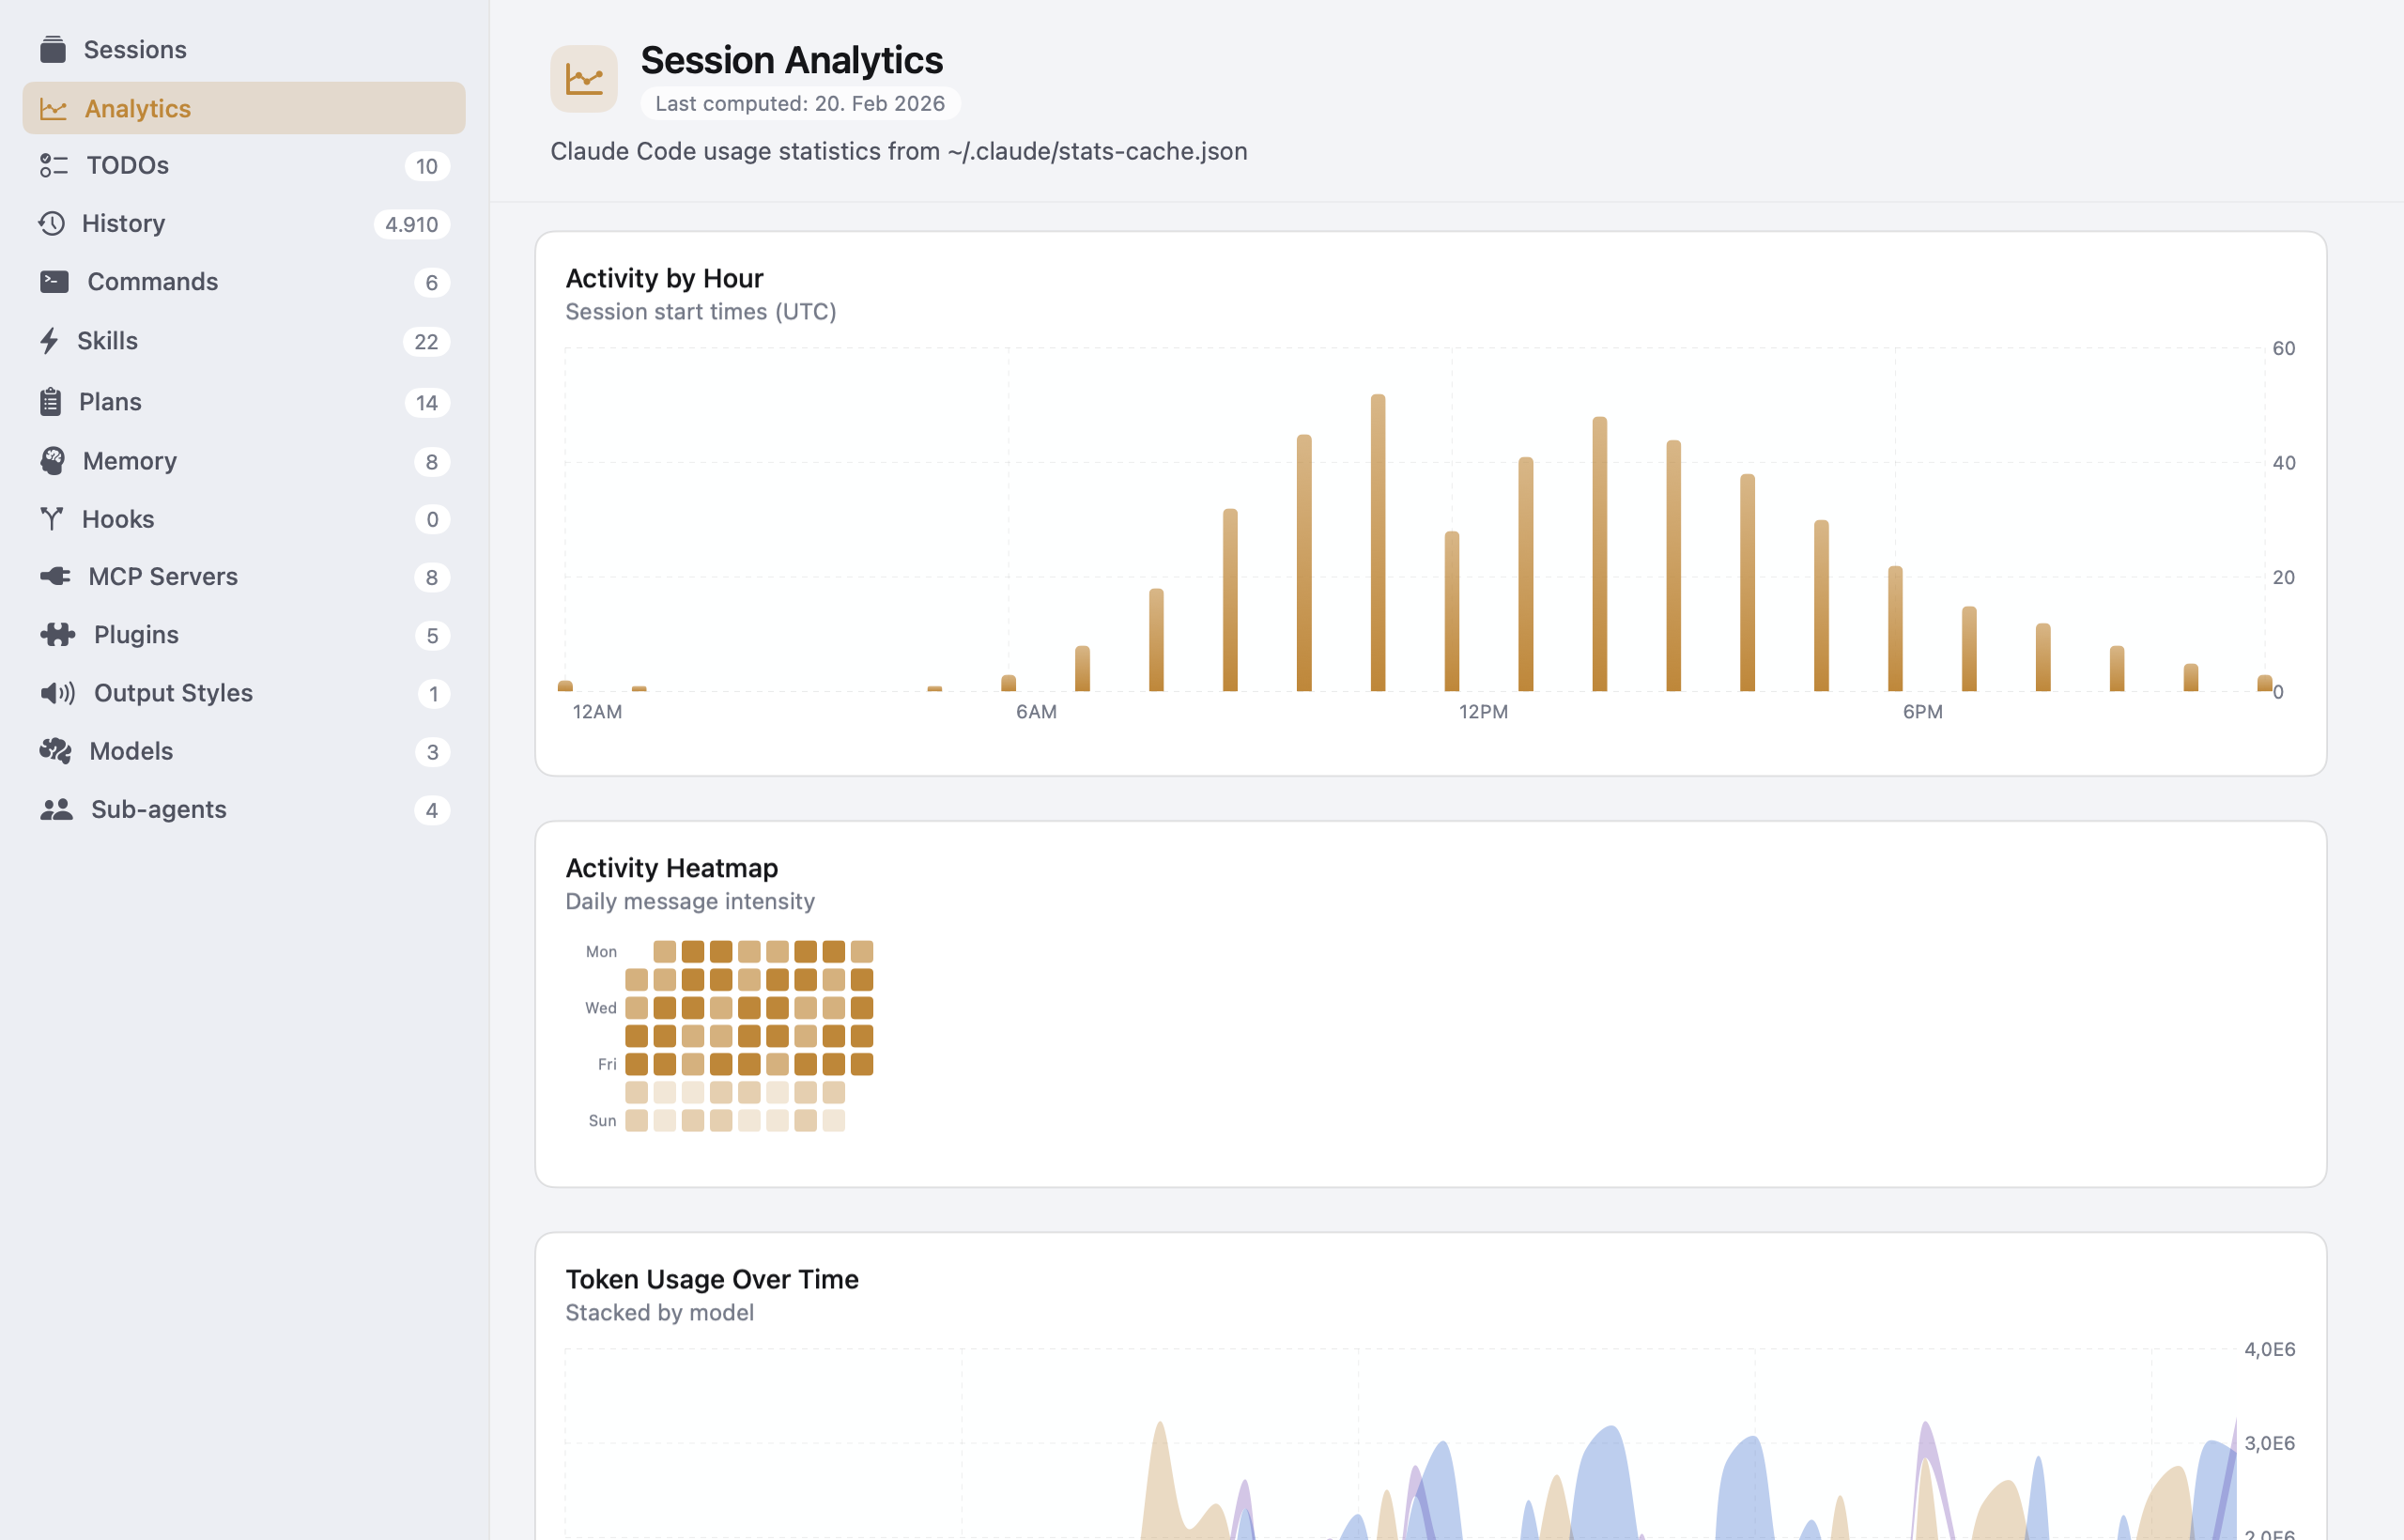
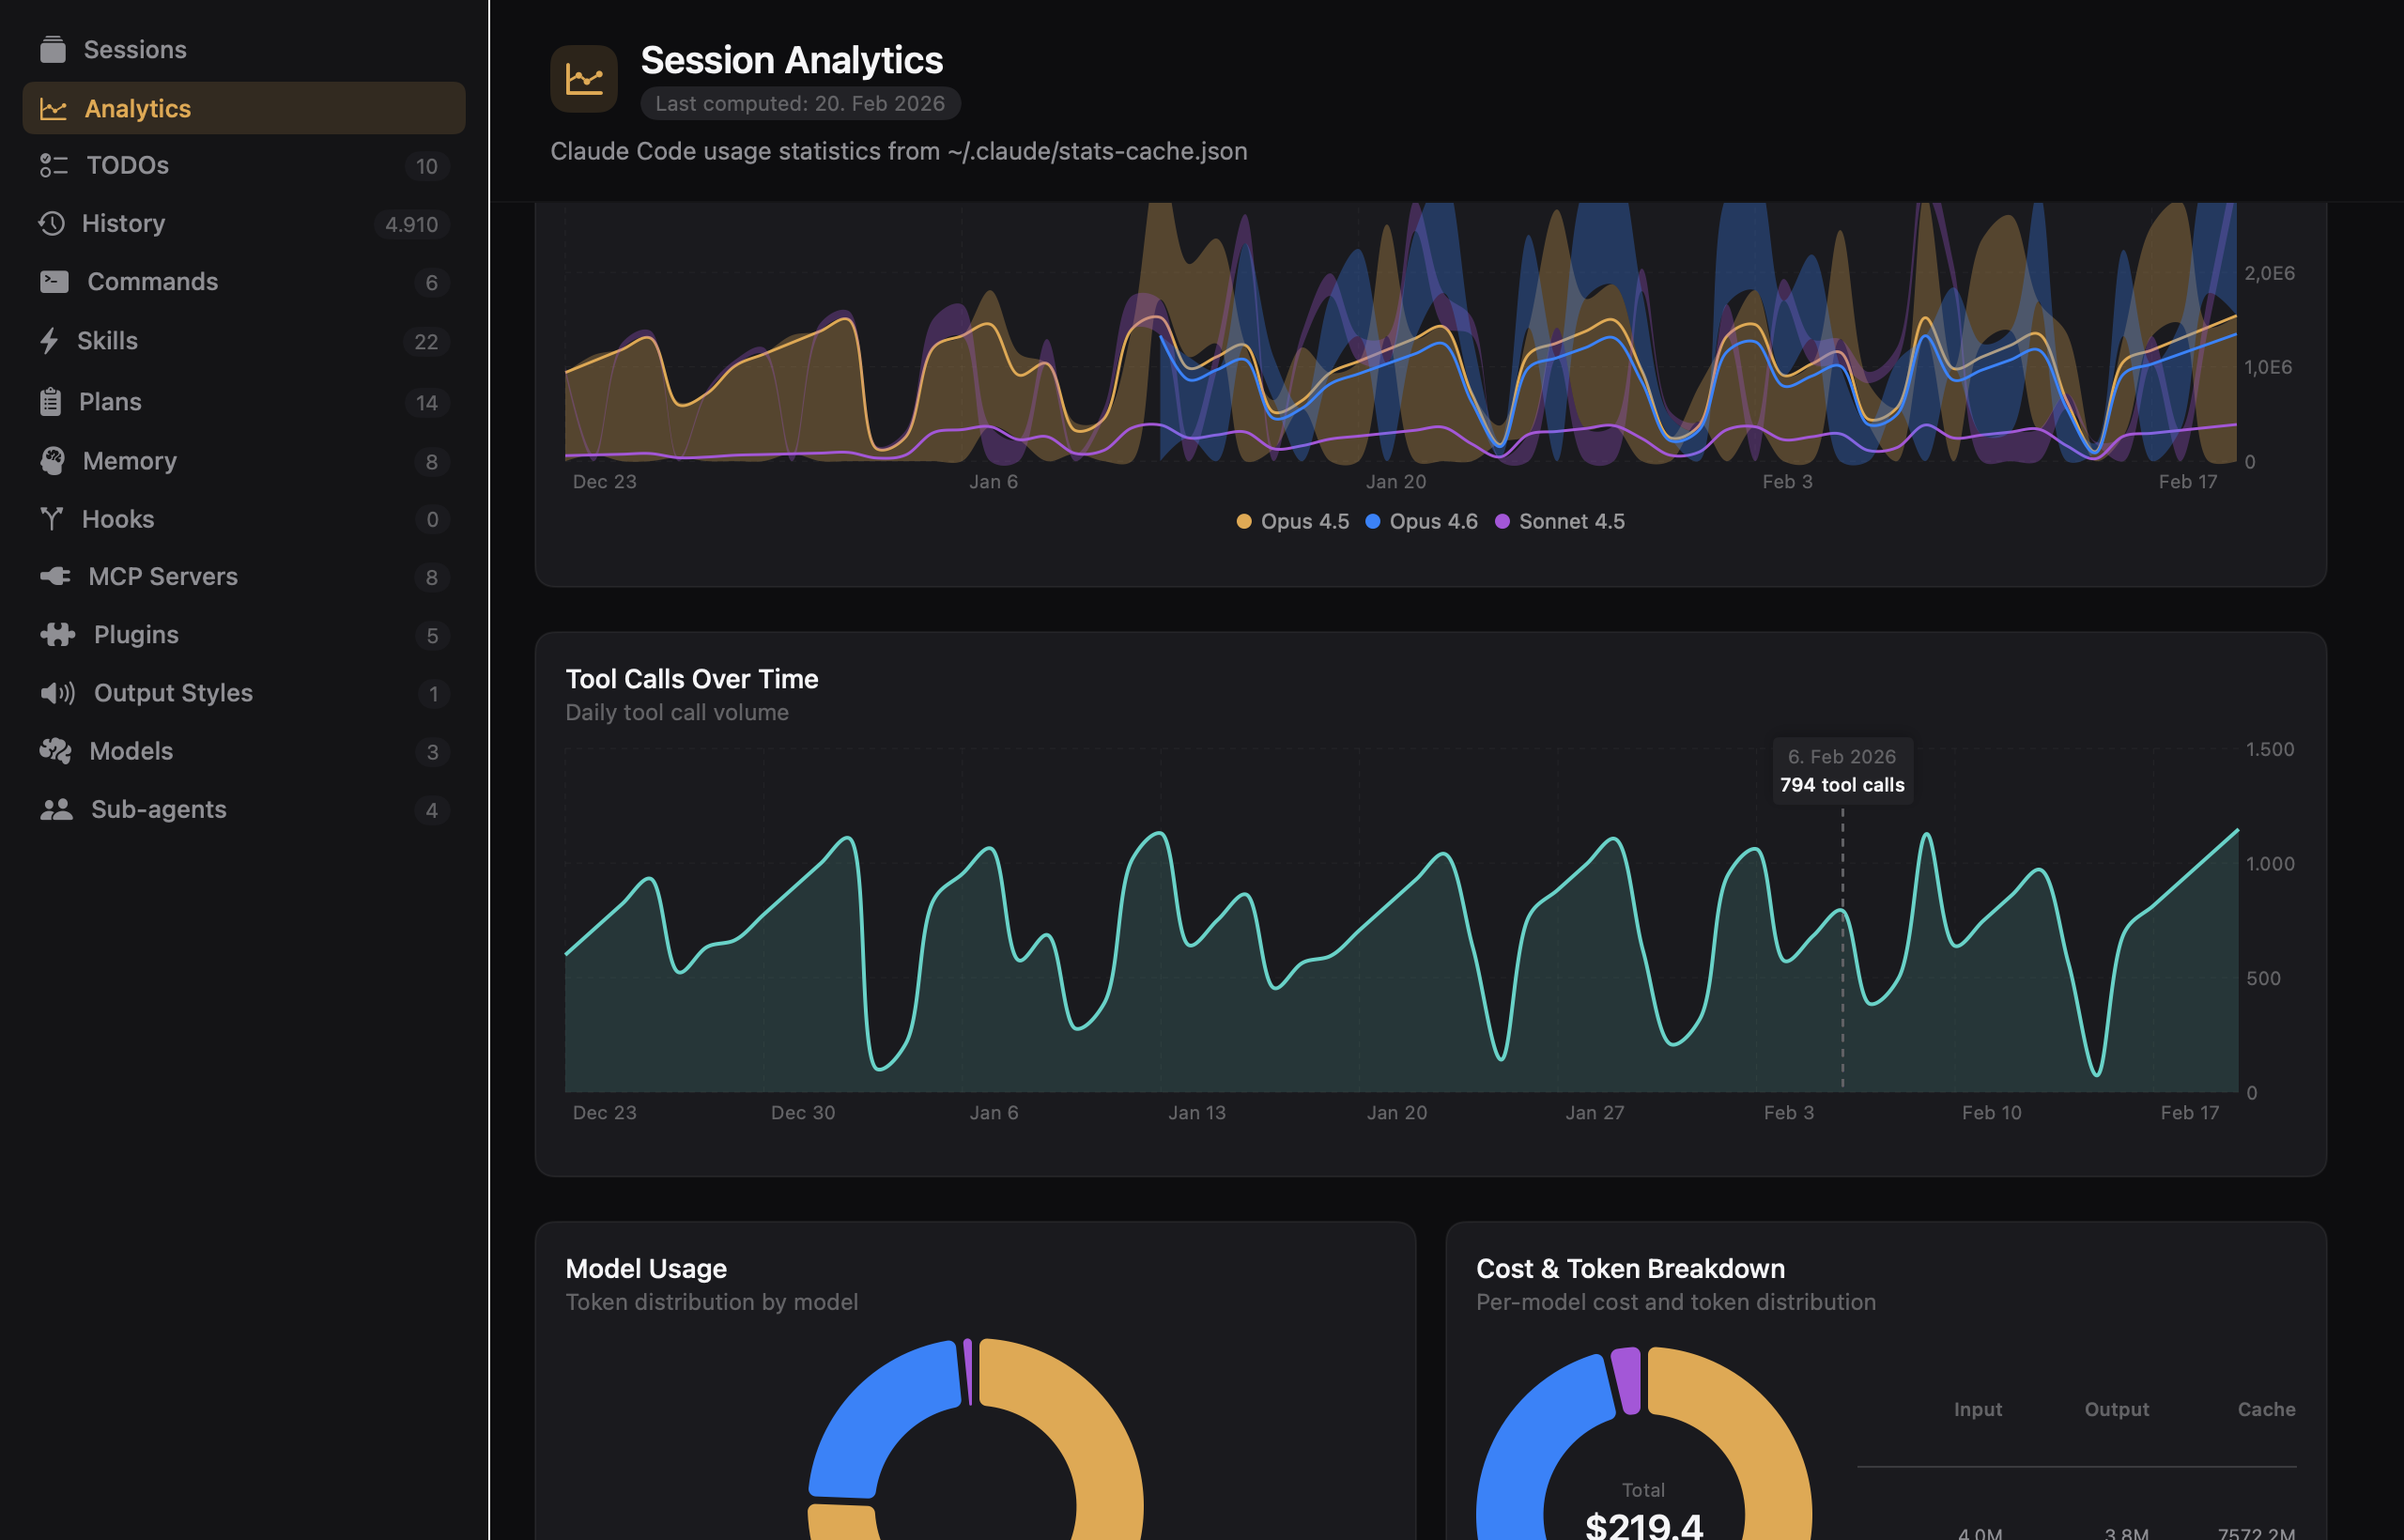
Visualize your Claude Code usage with interactive charts — daily activity, token usage over time, model distribution, tool call trends, cost breakdown, and a GitHub-style contribution heatmap. Filter by date range and export to CSV.
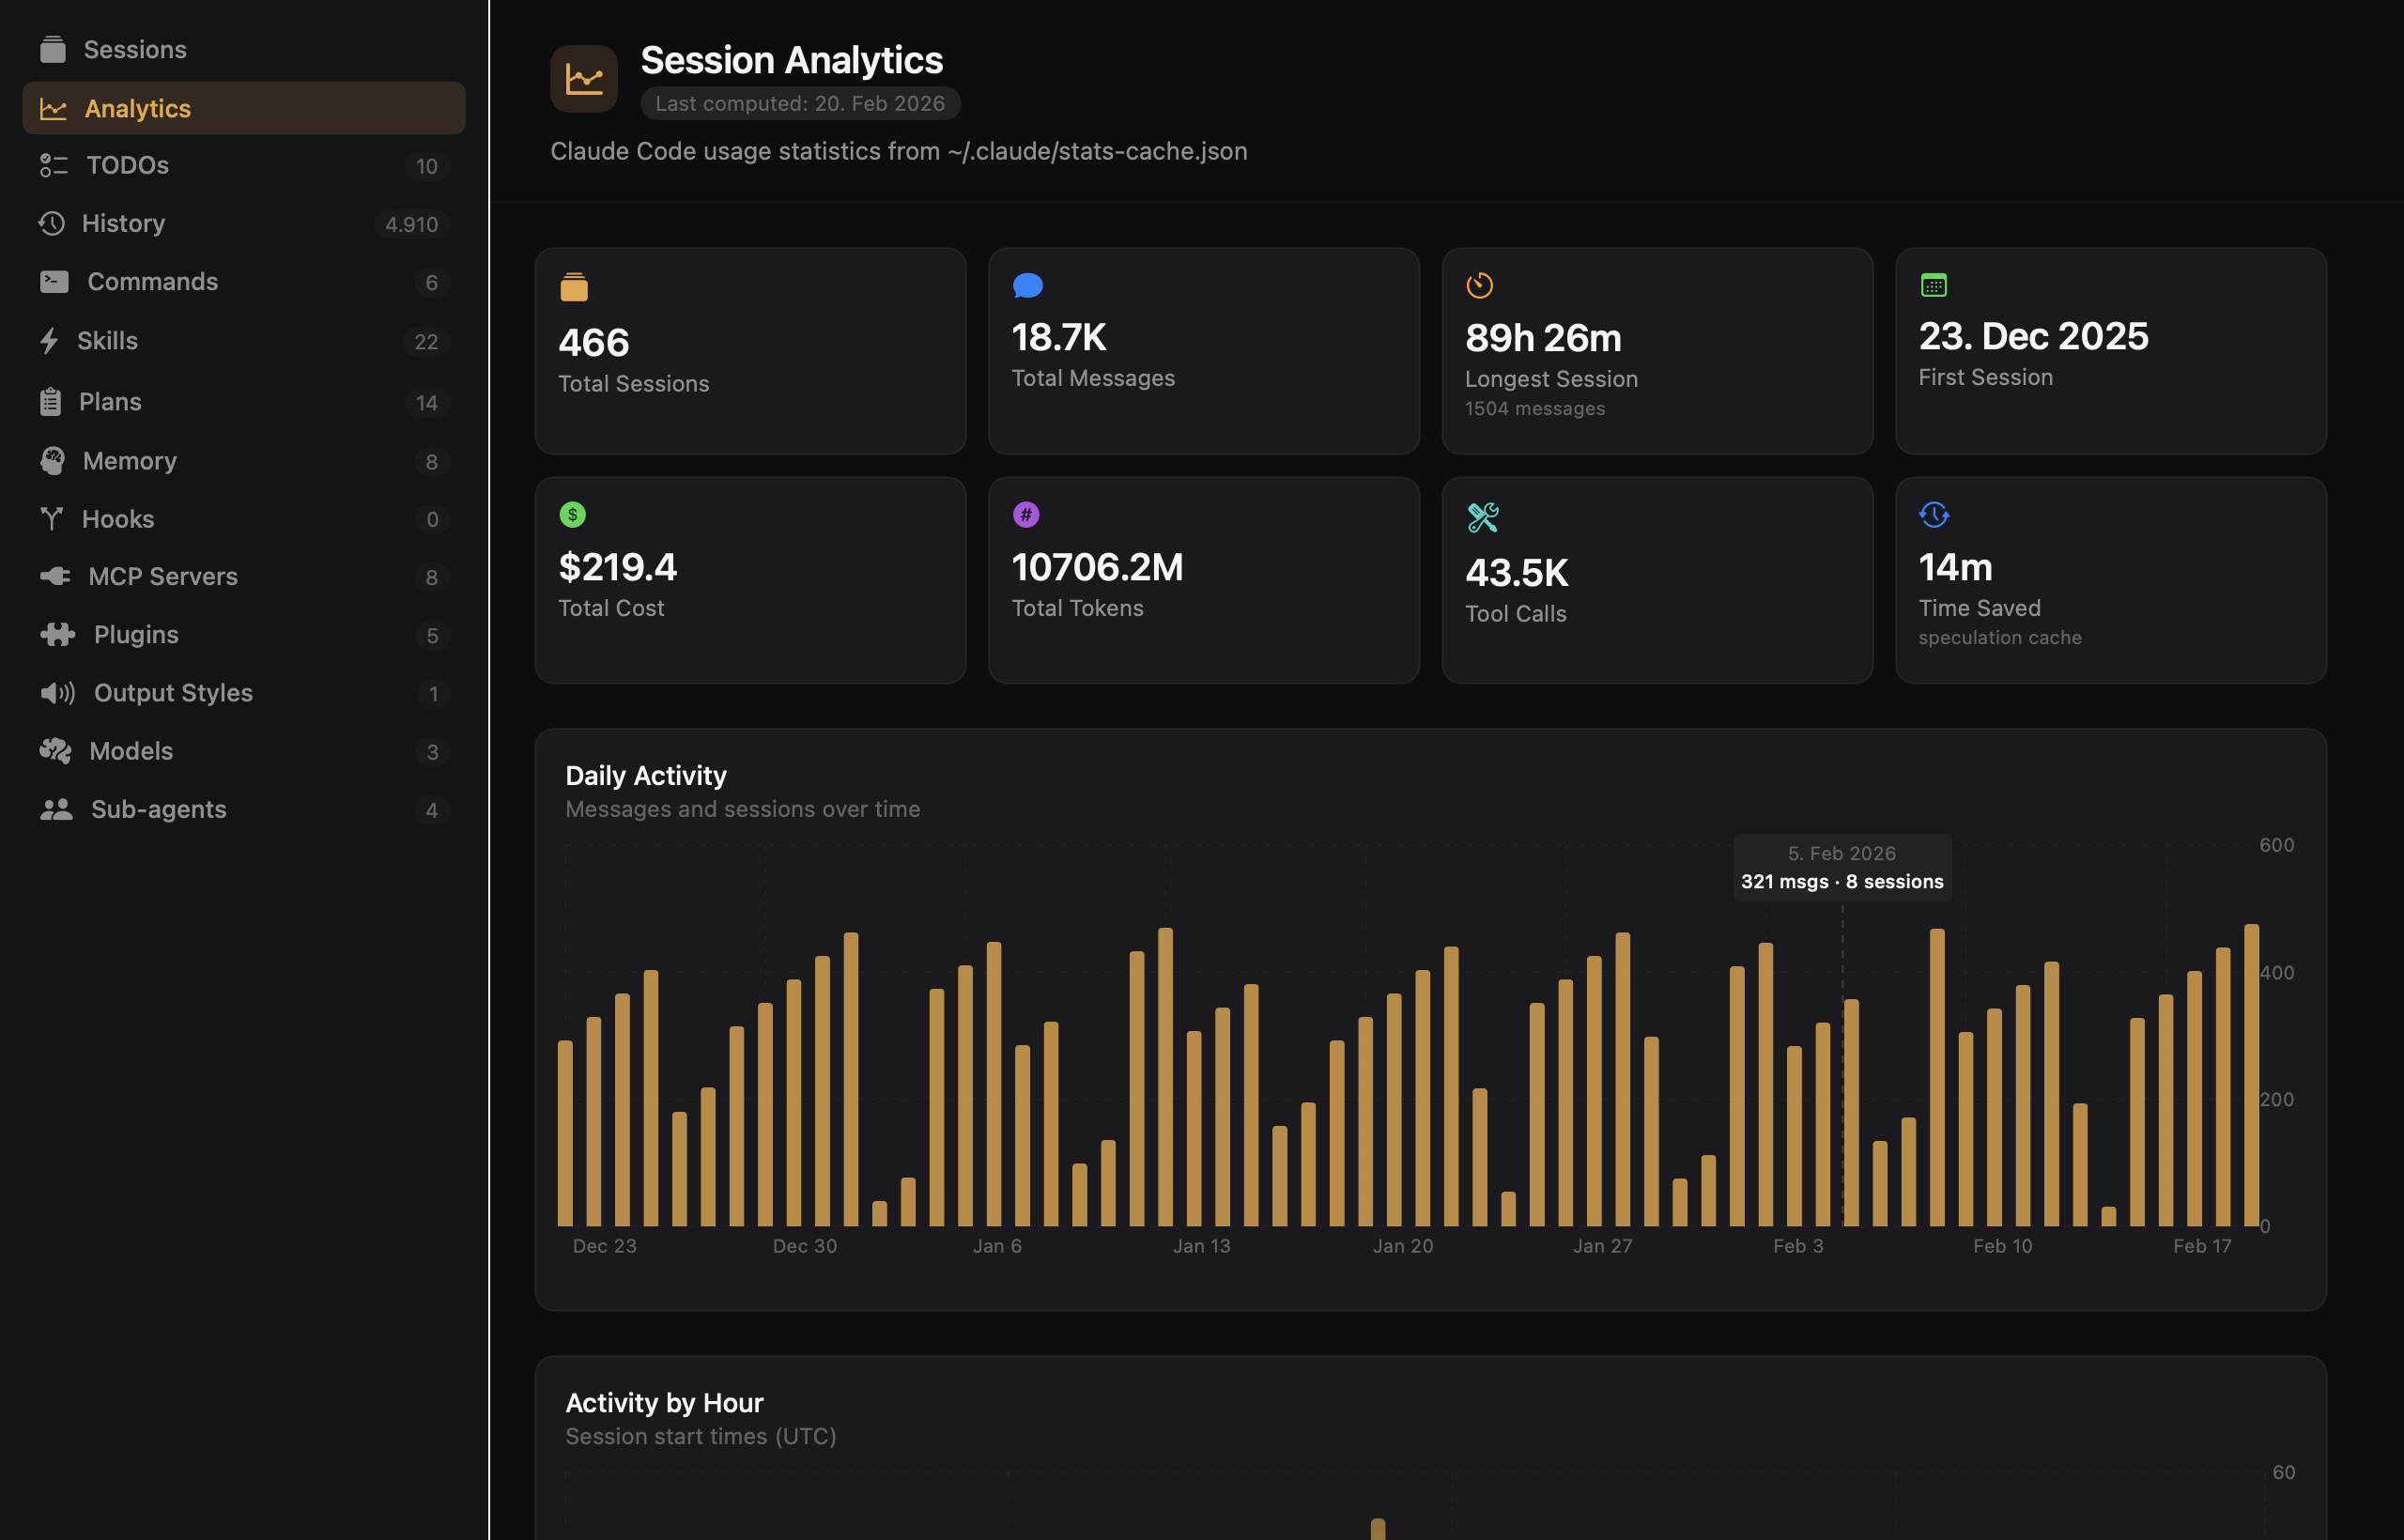
A GitHub-style contribution heatmap shows your coding intensity at a glance. Token usage over time is stacked by model so you can track how your usage evolves — all rendered beautifully in both dark and light mode.
See exactly where your tokens and dollars go. Tool call trends over time, model distribution donut charts, and a per-model cost breakdown — everything you need to understand and optimize your Claude Code usage.
Sub-agent sessions are automatically grouped under their parent session. Expand any parent to see its spawned agents — Explore, Plan, and others — with type badges, descriptions, and token counts. A timeline view shows all sessions as a Gantt chart, so you can see what ran in parallel.
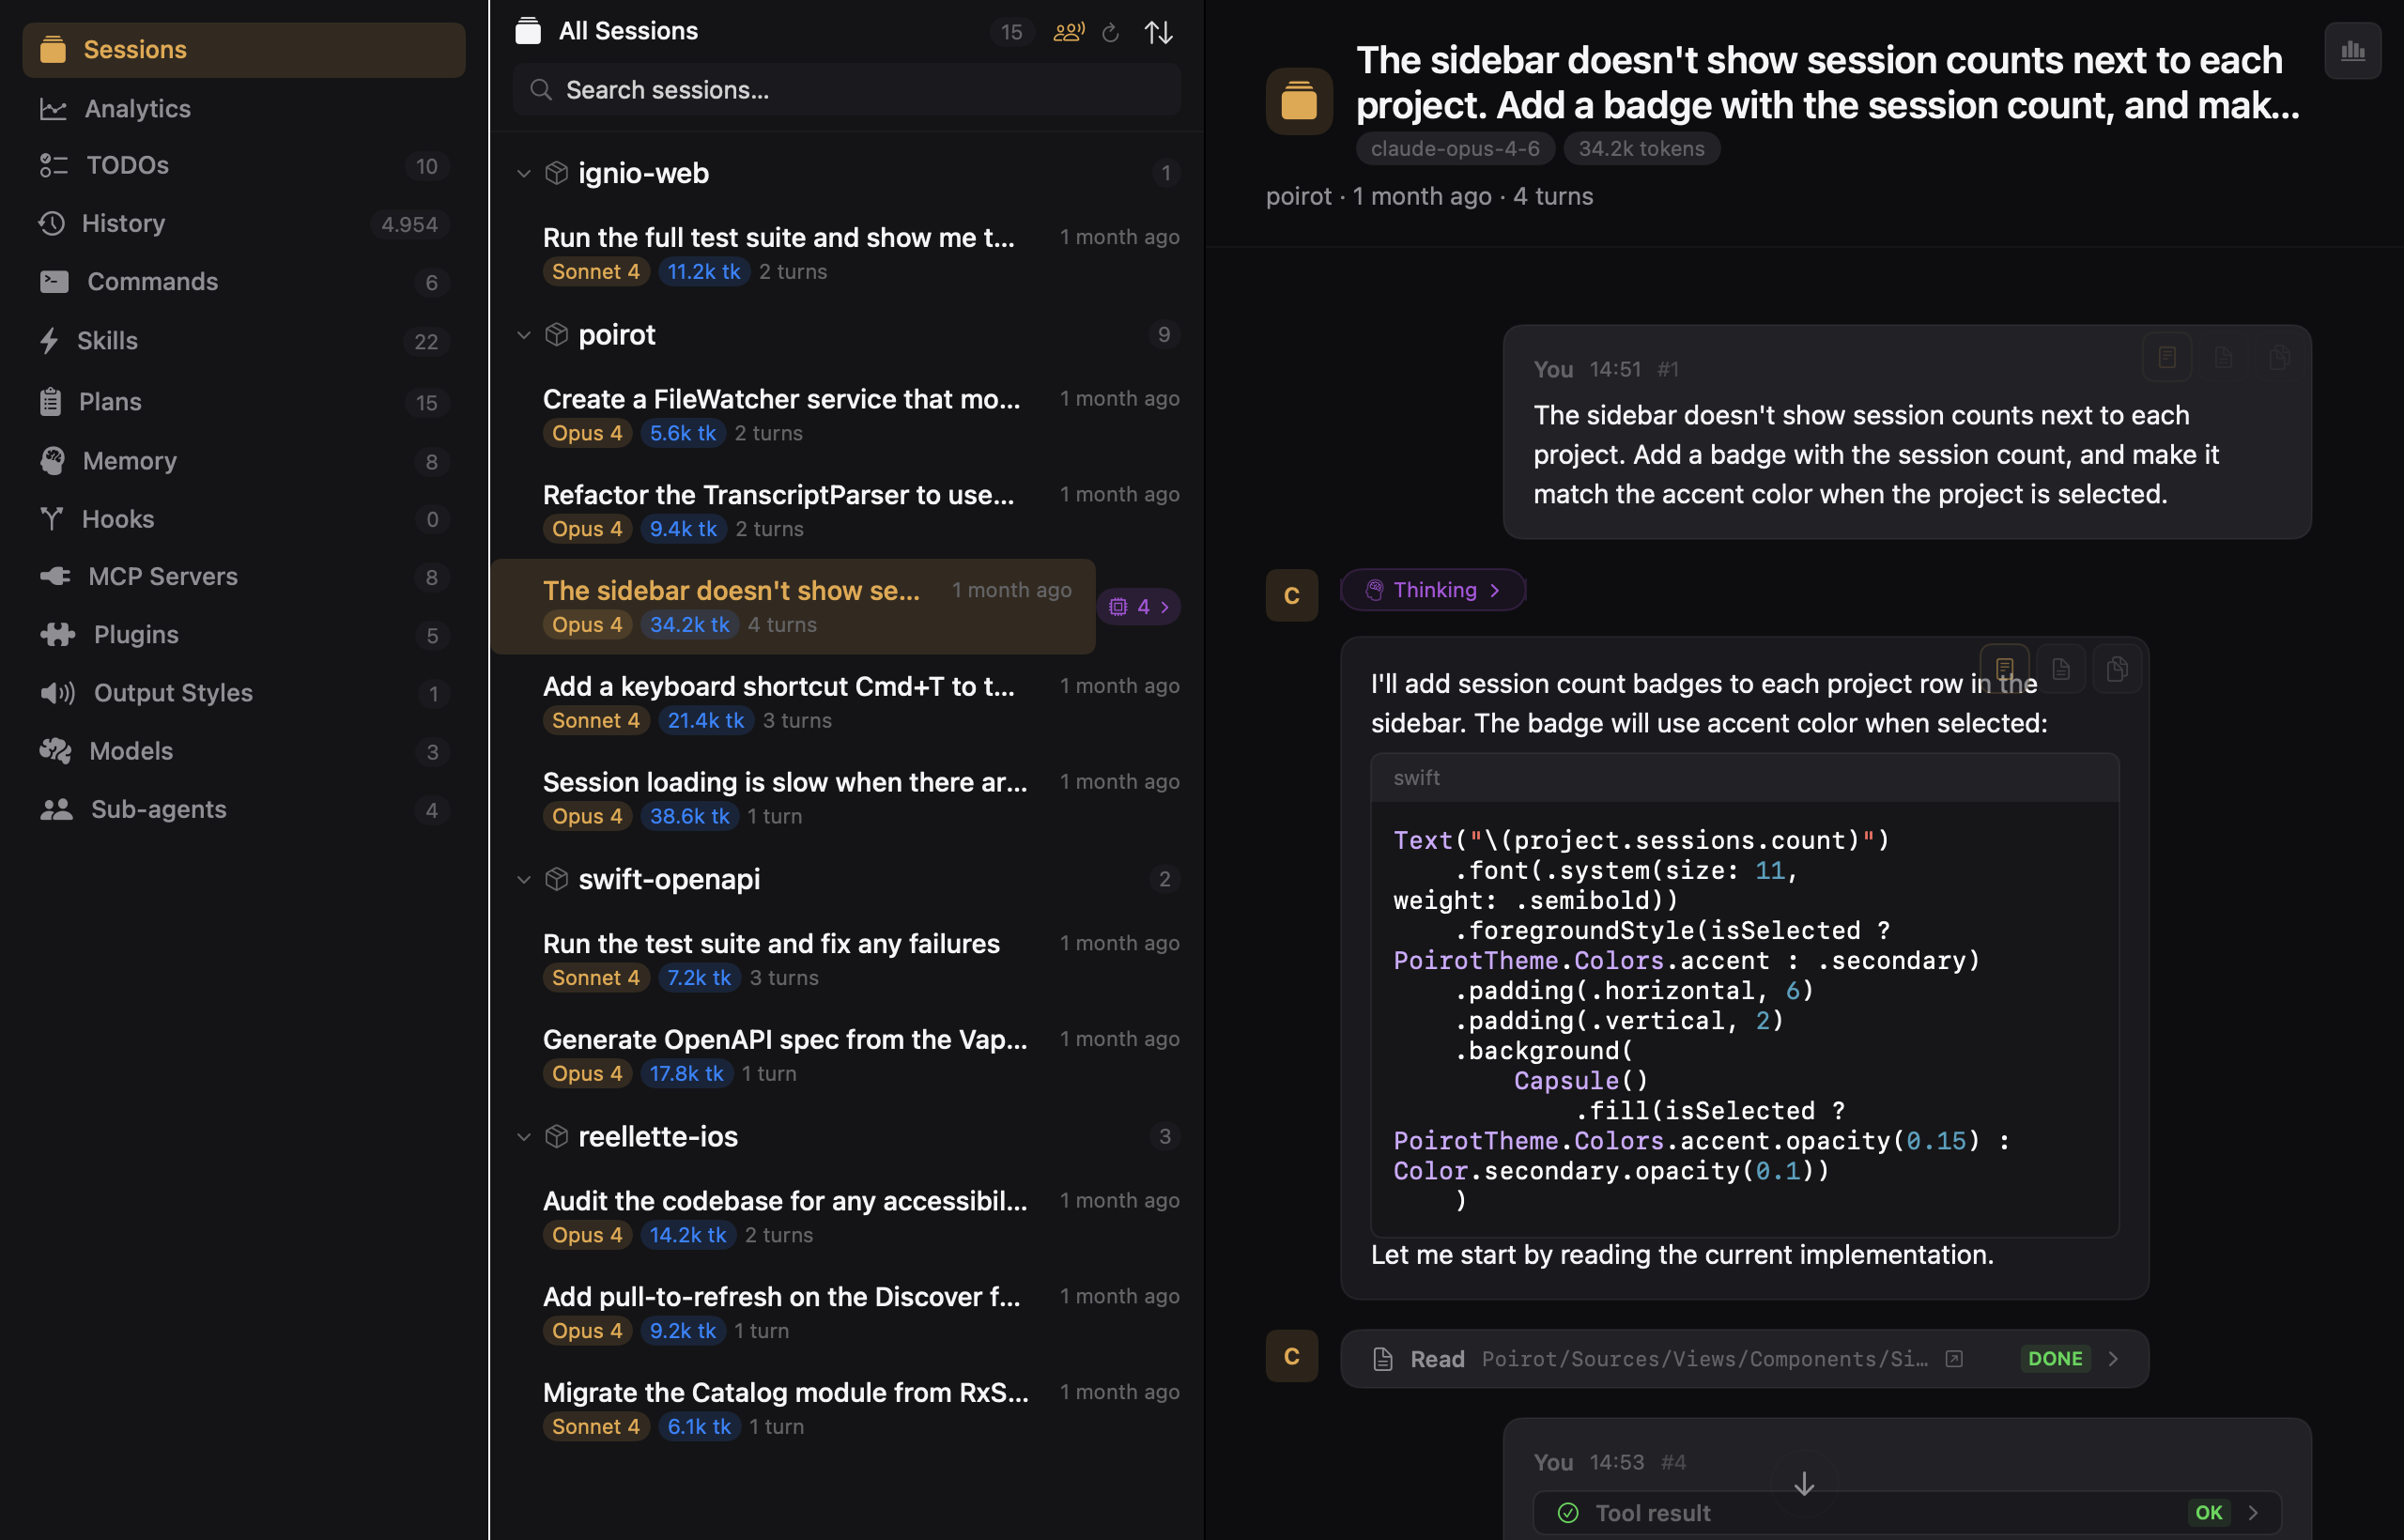
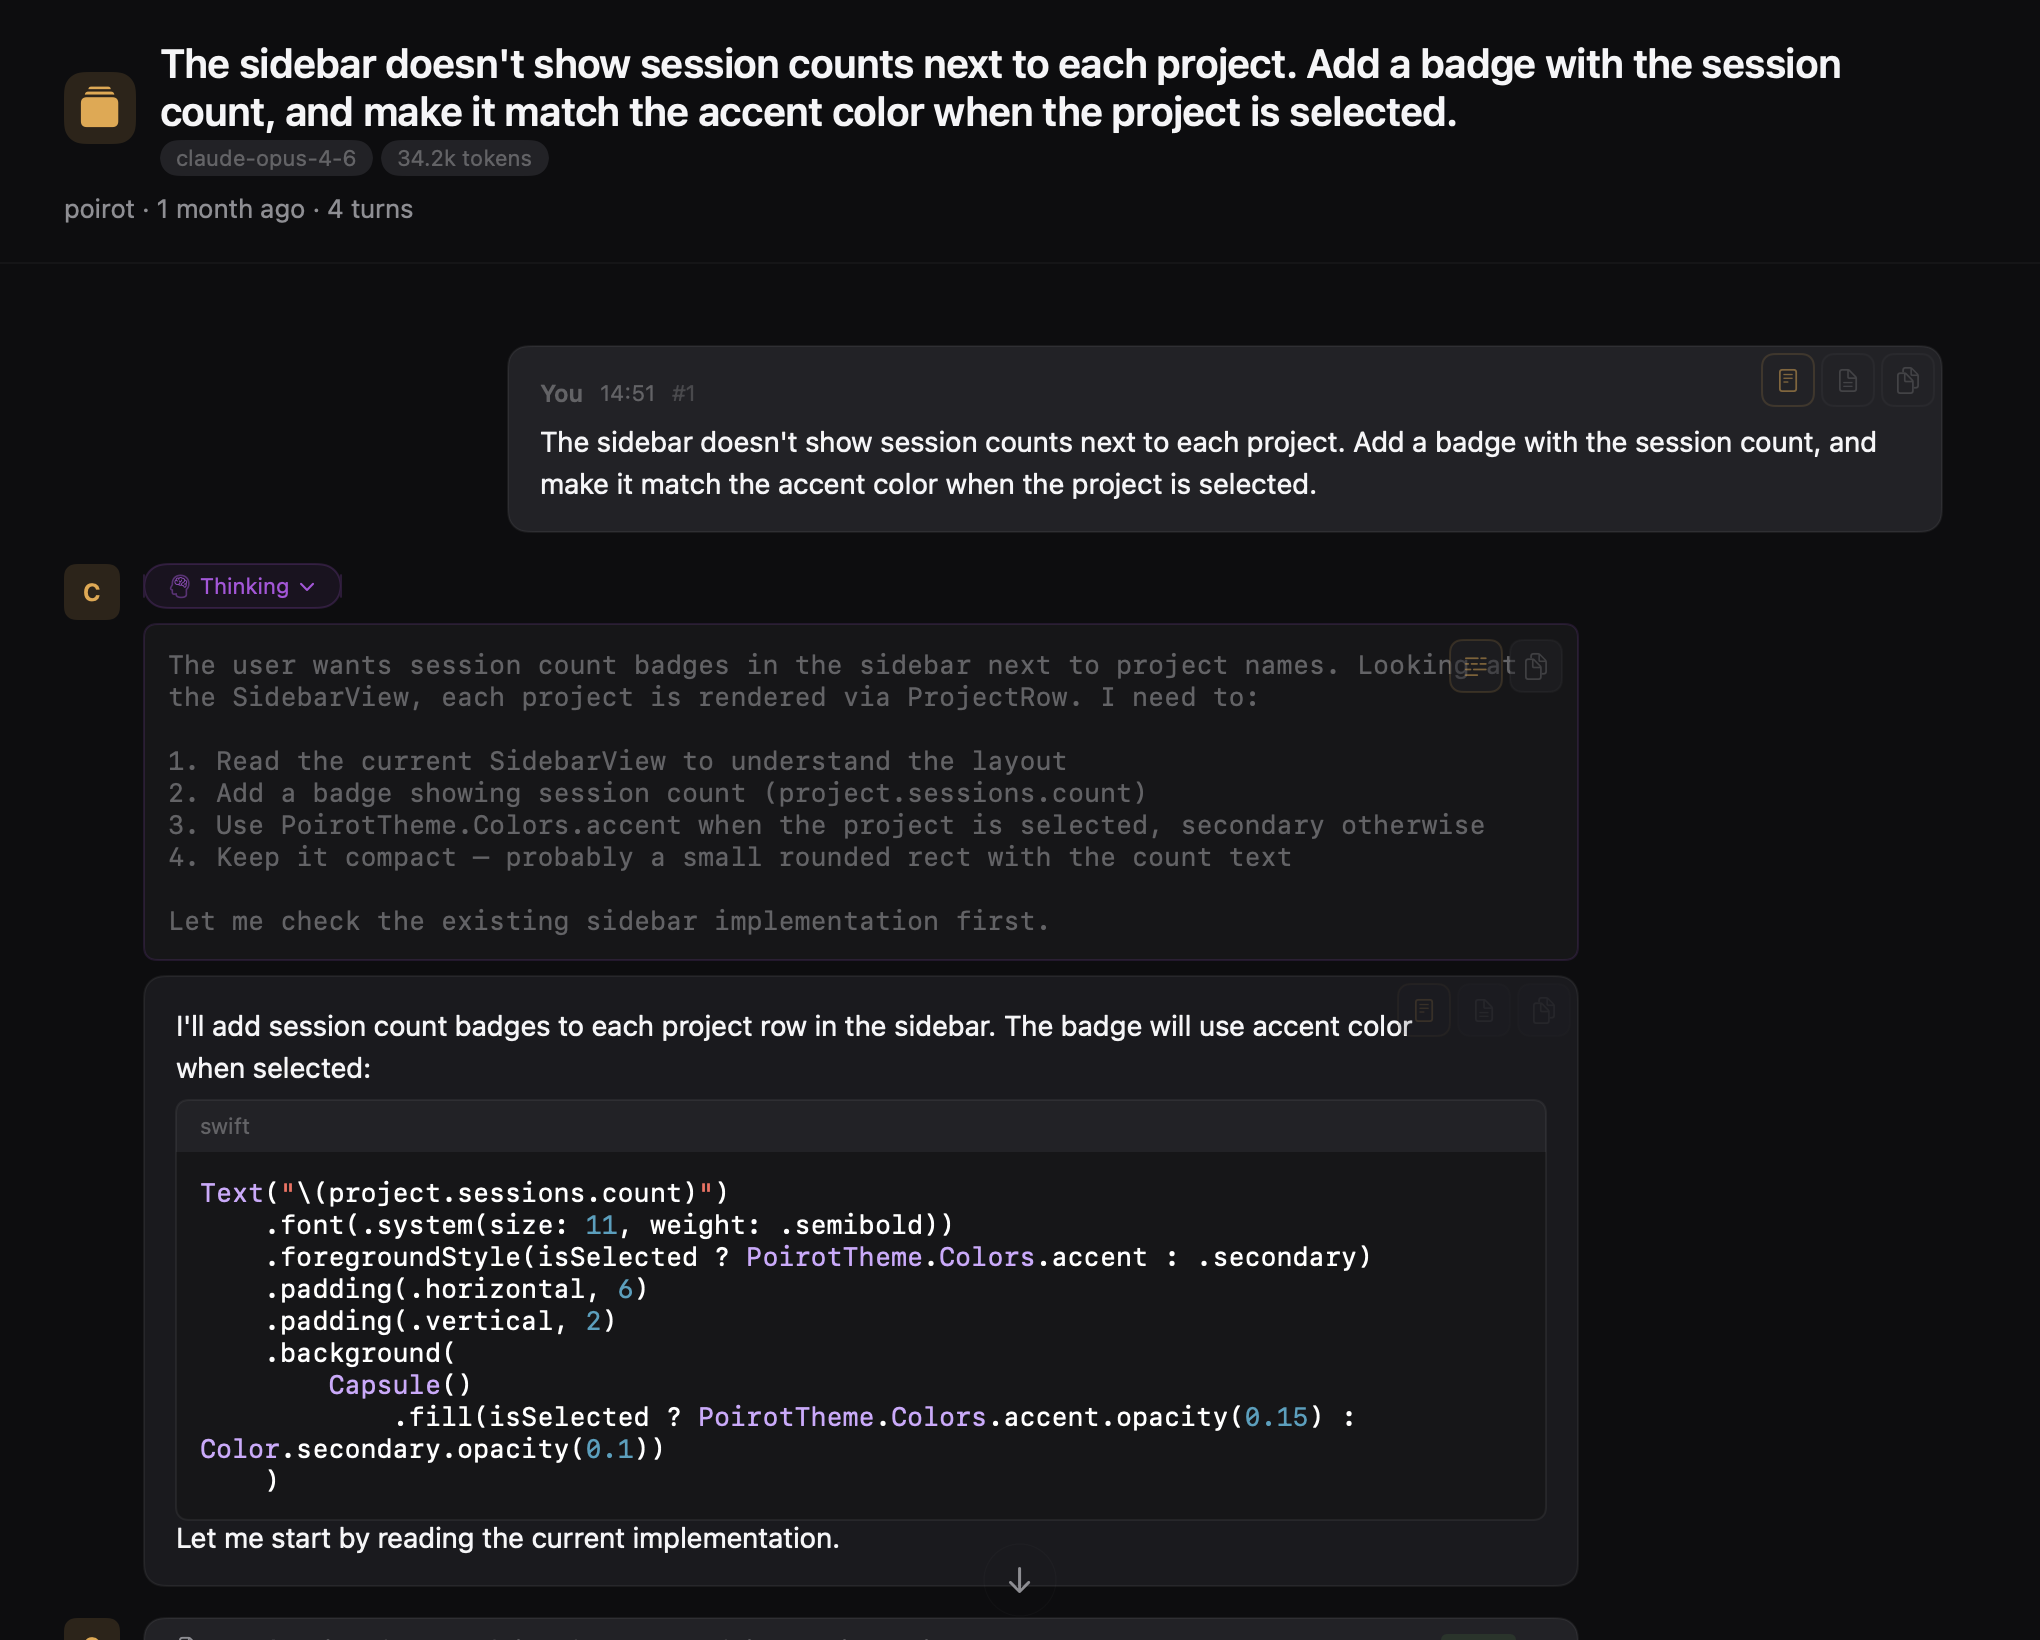
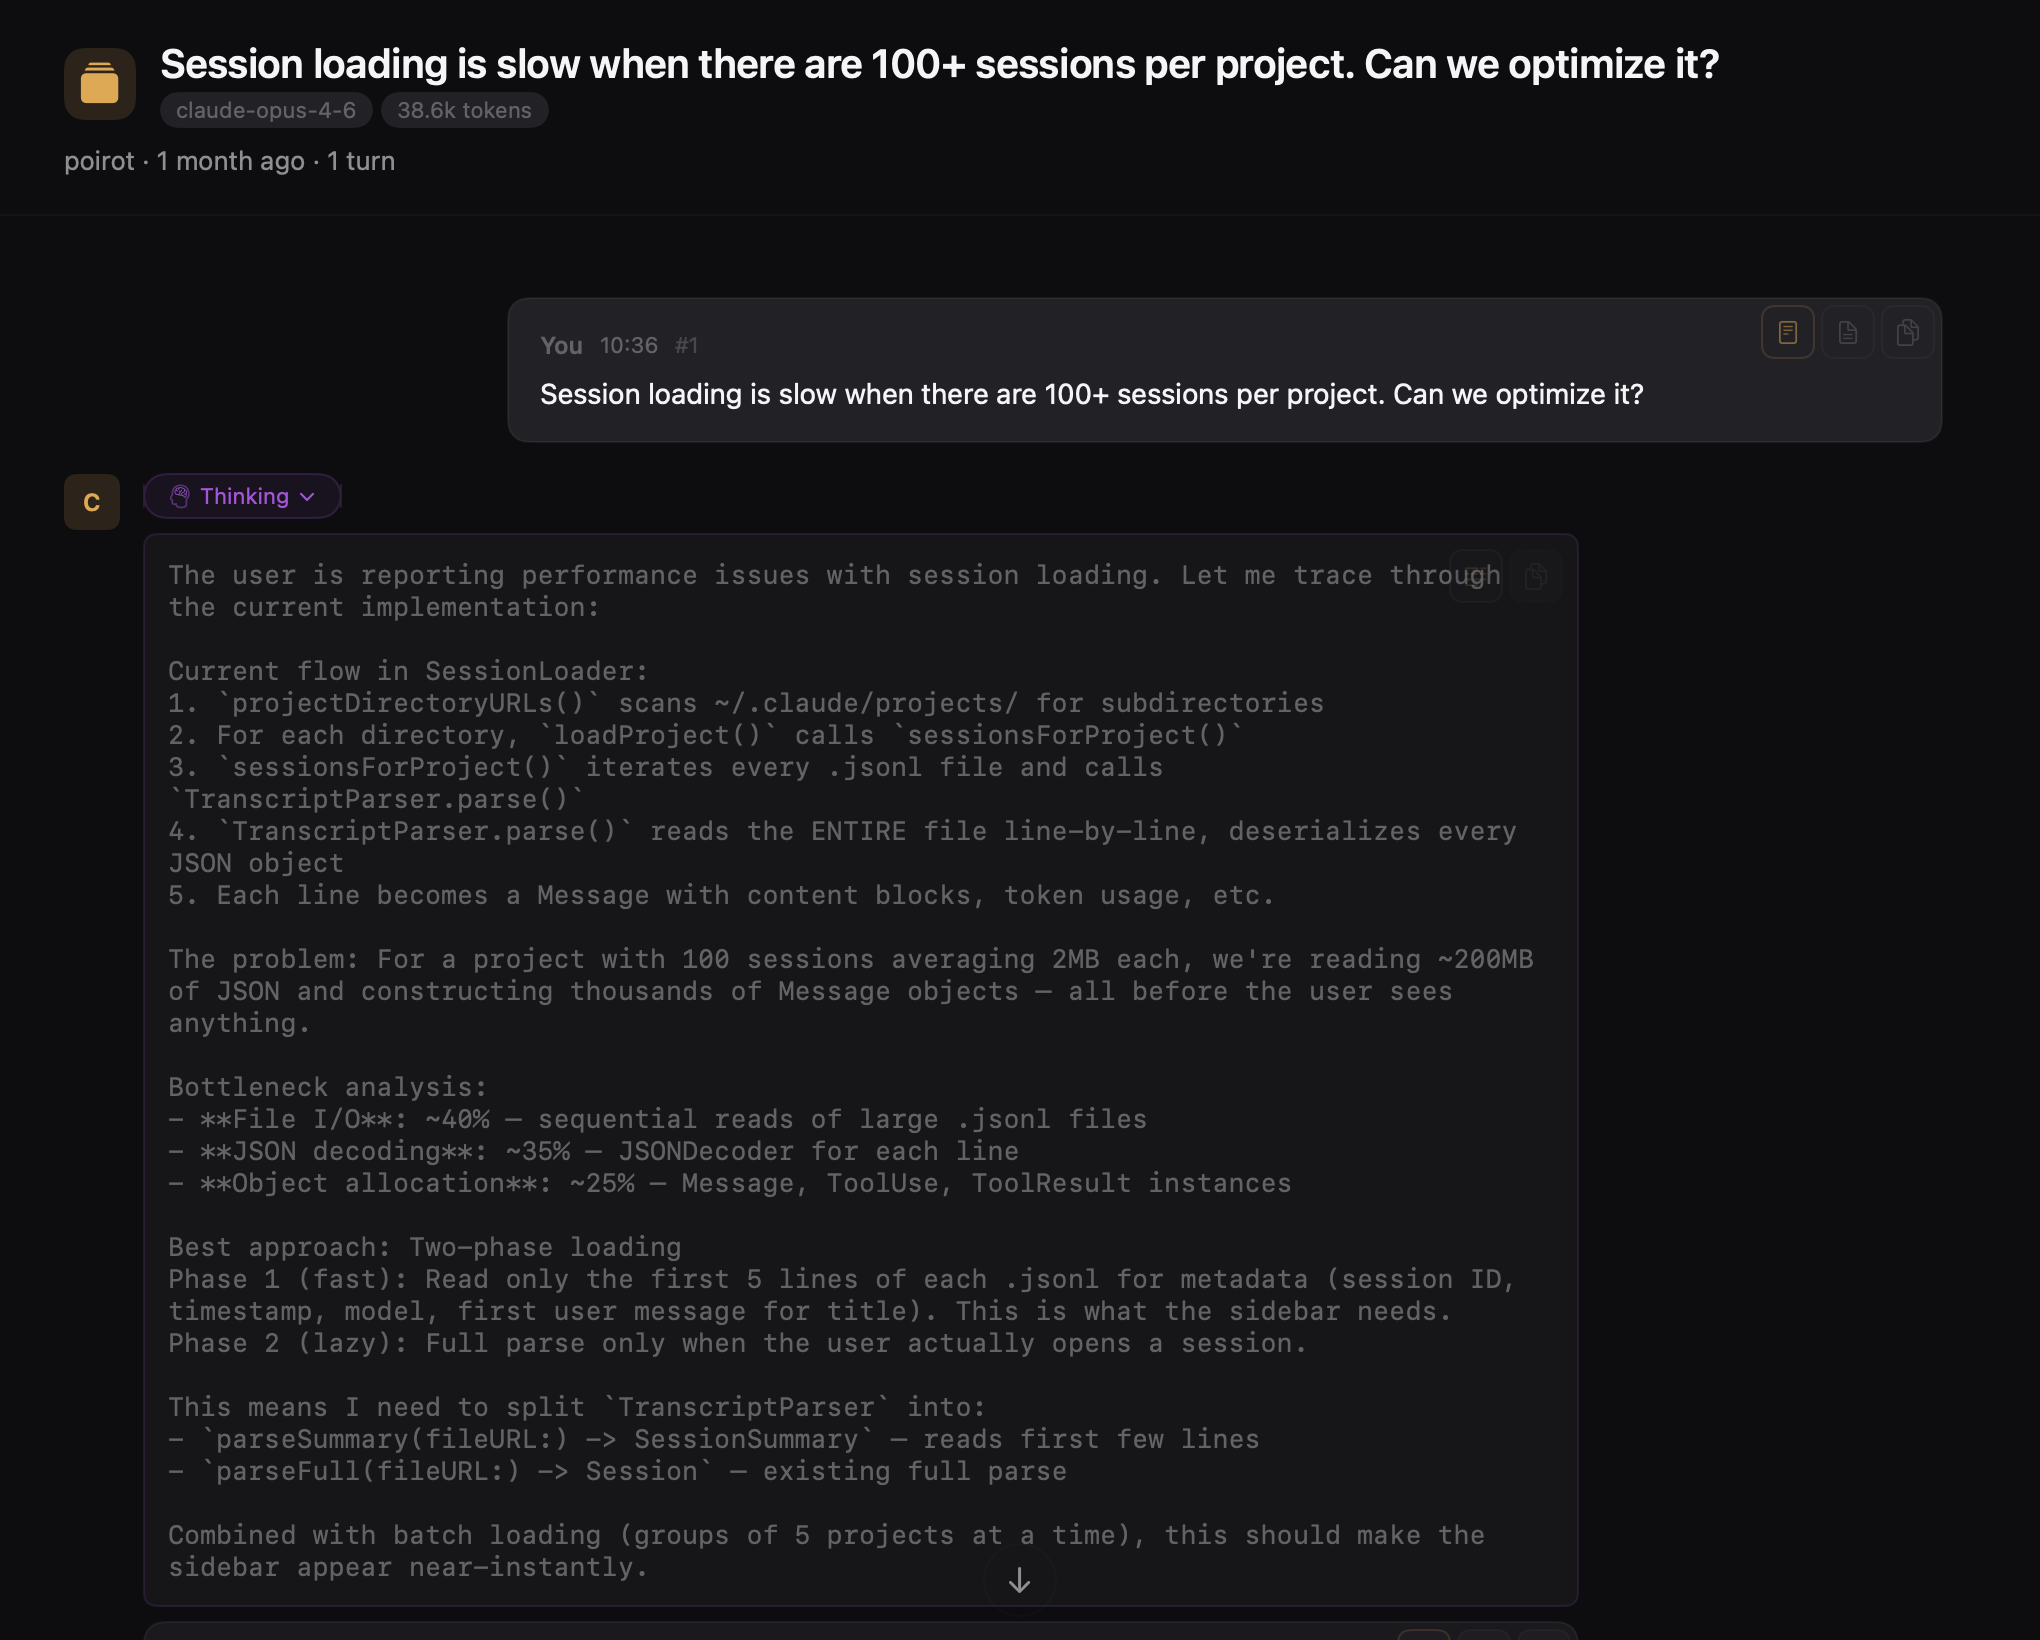
Full conversation timeline with user messages, assistant responses, and collapsible tool blocks. Markdown rendering with syntax highlighting, because raw JSONL is not fun to read.
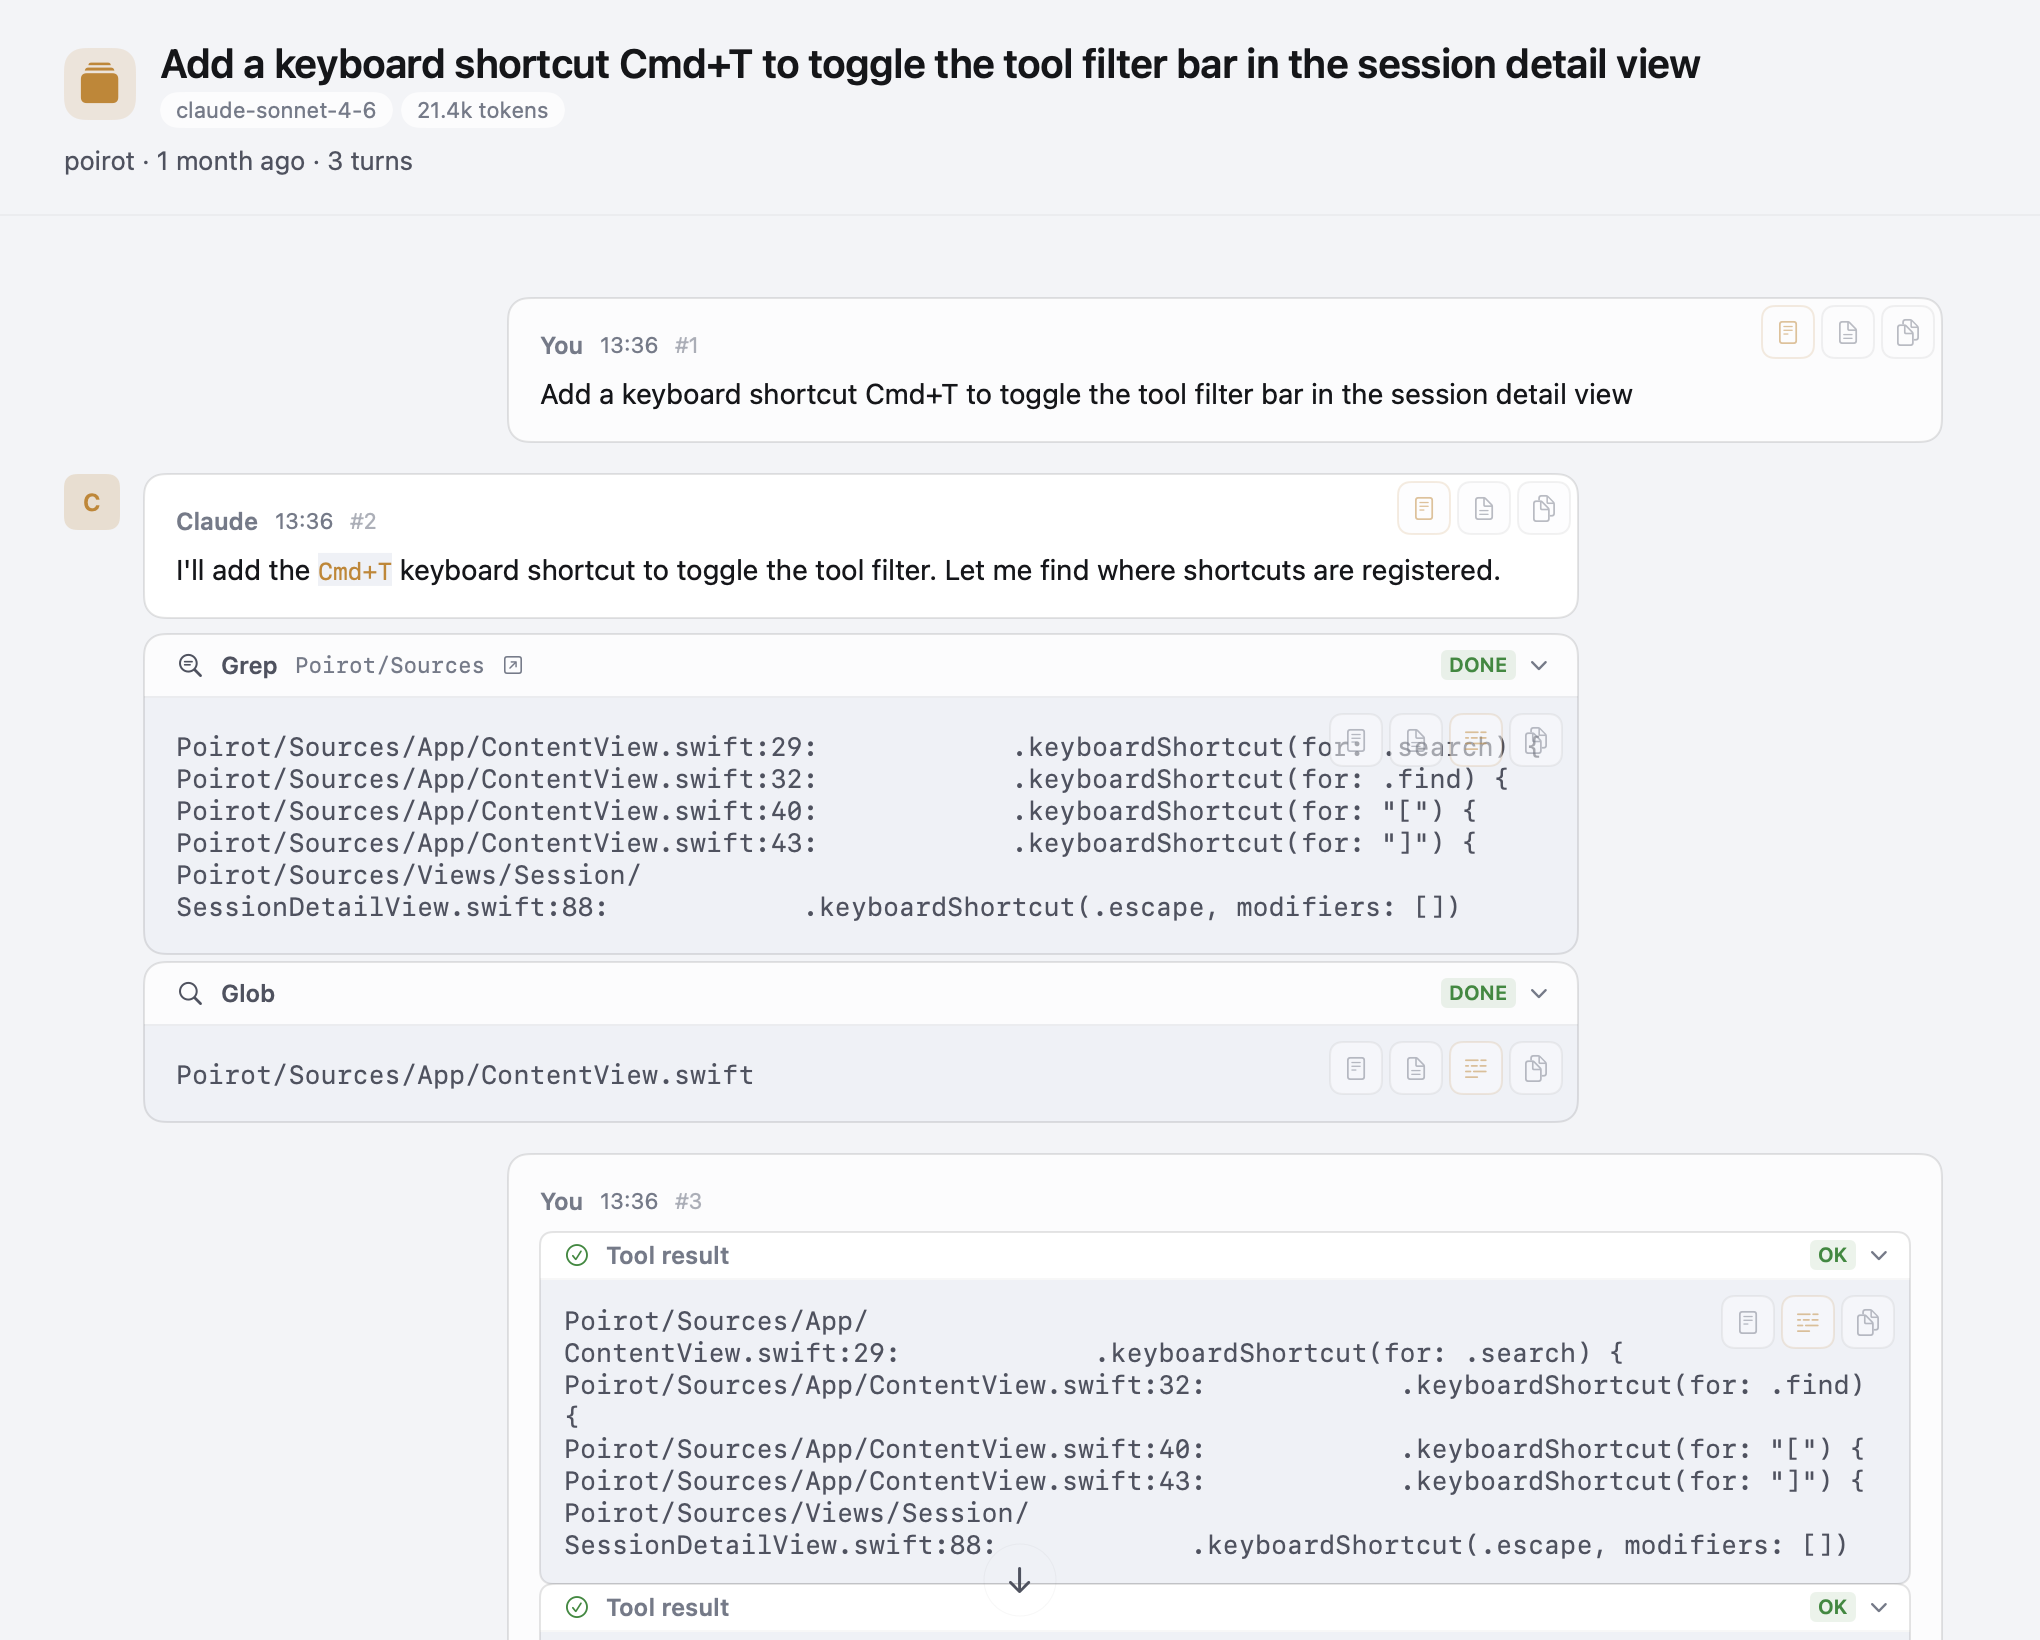
Every tool invocation — Read, Edit, Bash, Write — rendered with its name, icon, file path, and result. Collapsible, copyable, and with smart truncation for long outputs.
See Claude's thinking process with collapsible thinking blocks, styled with a distinct purple accent so you can tell reasoning from response.
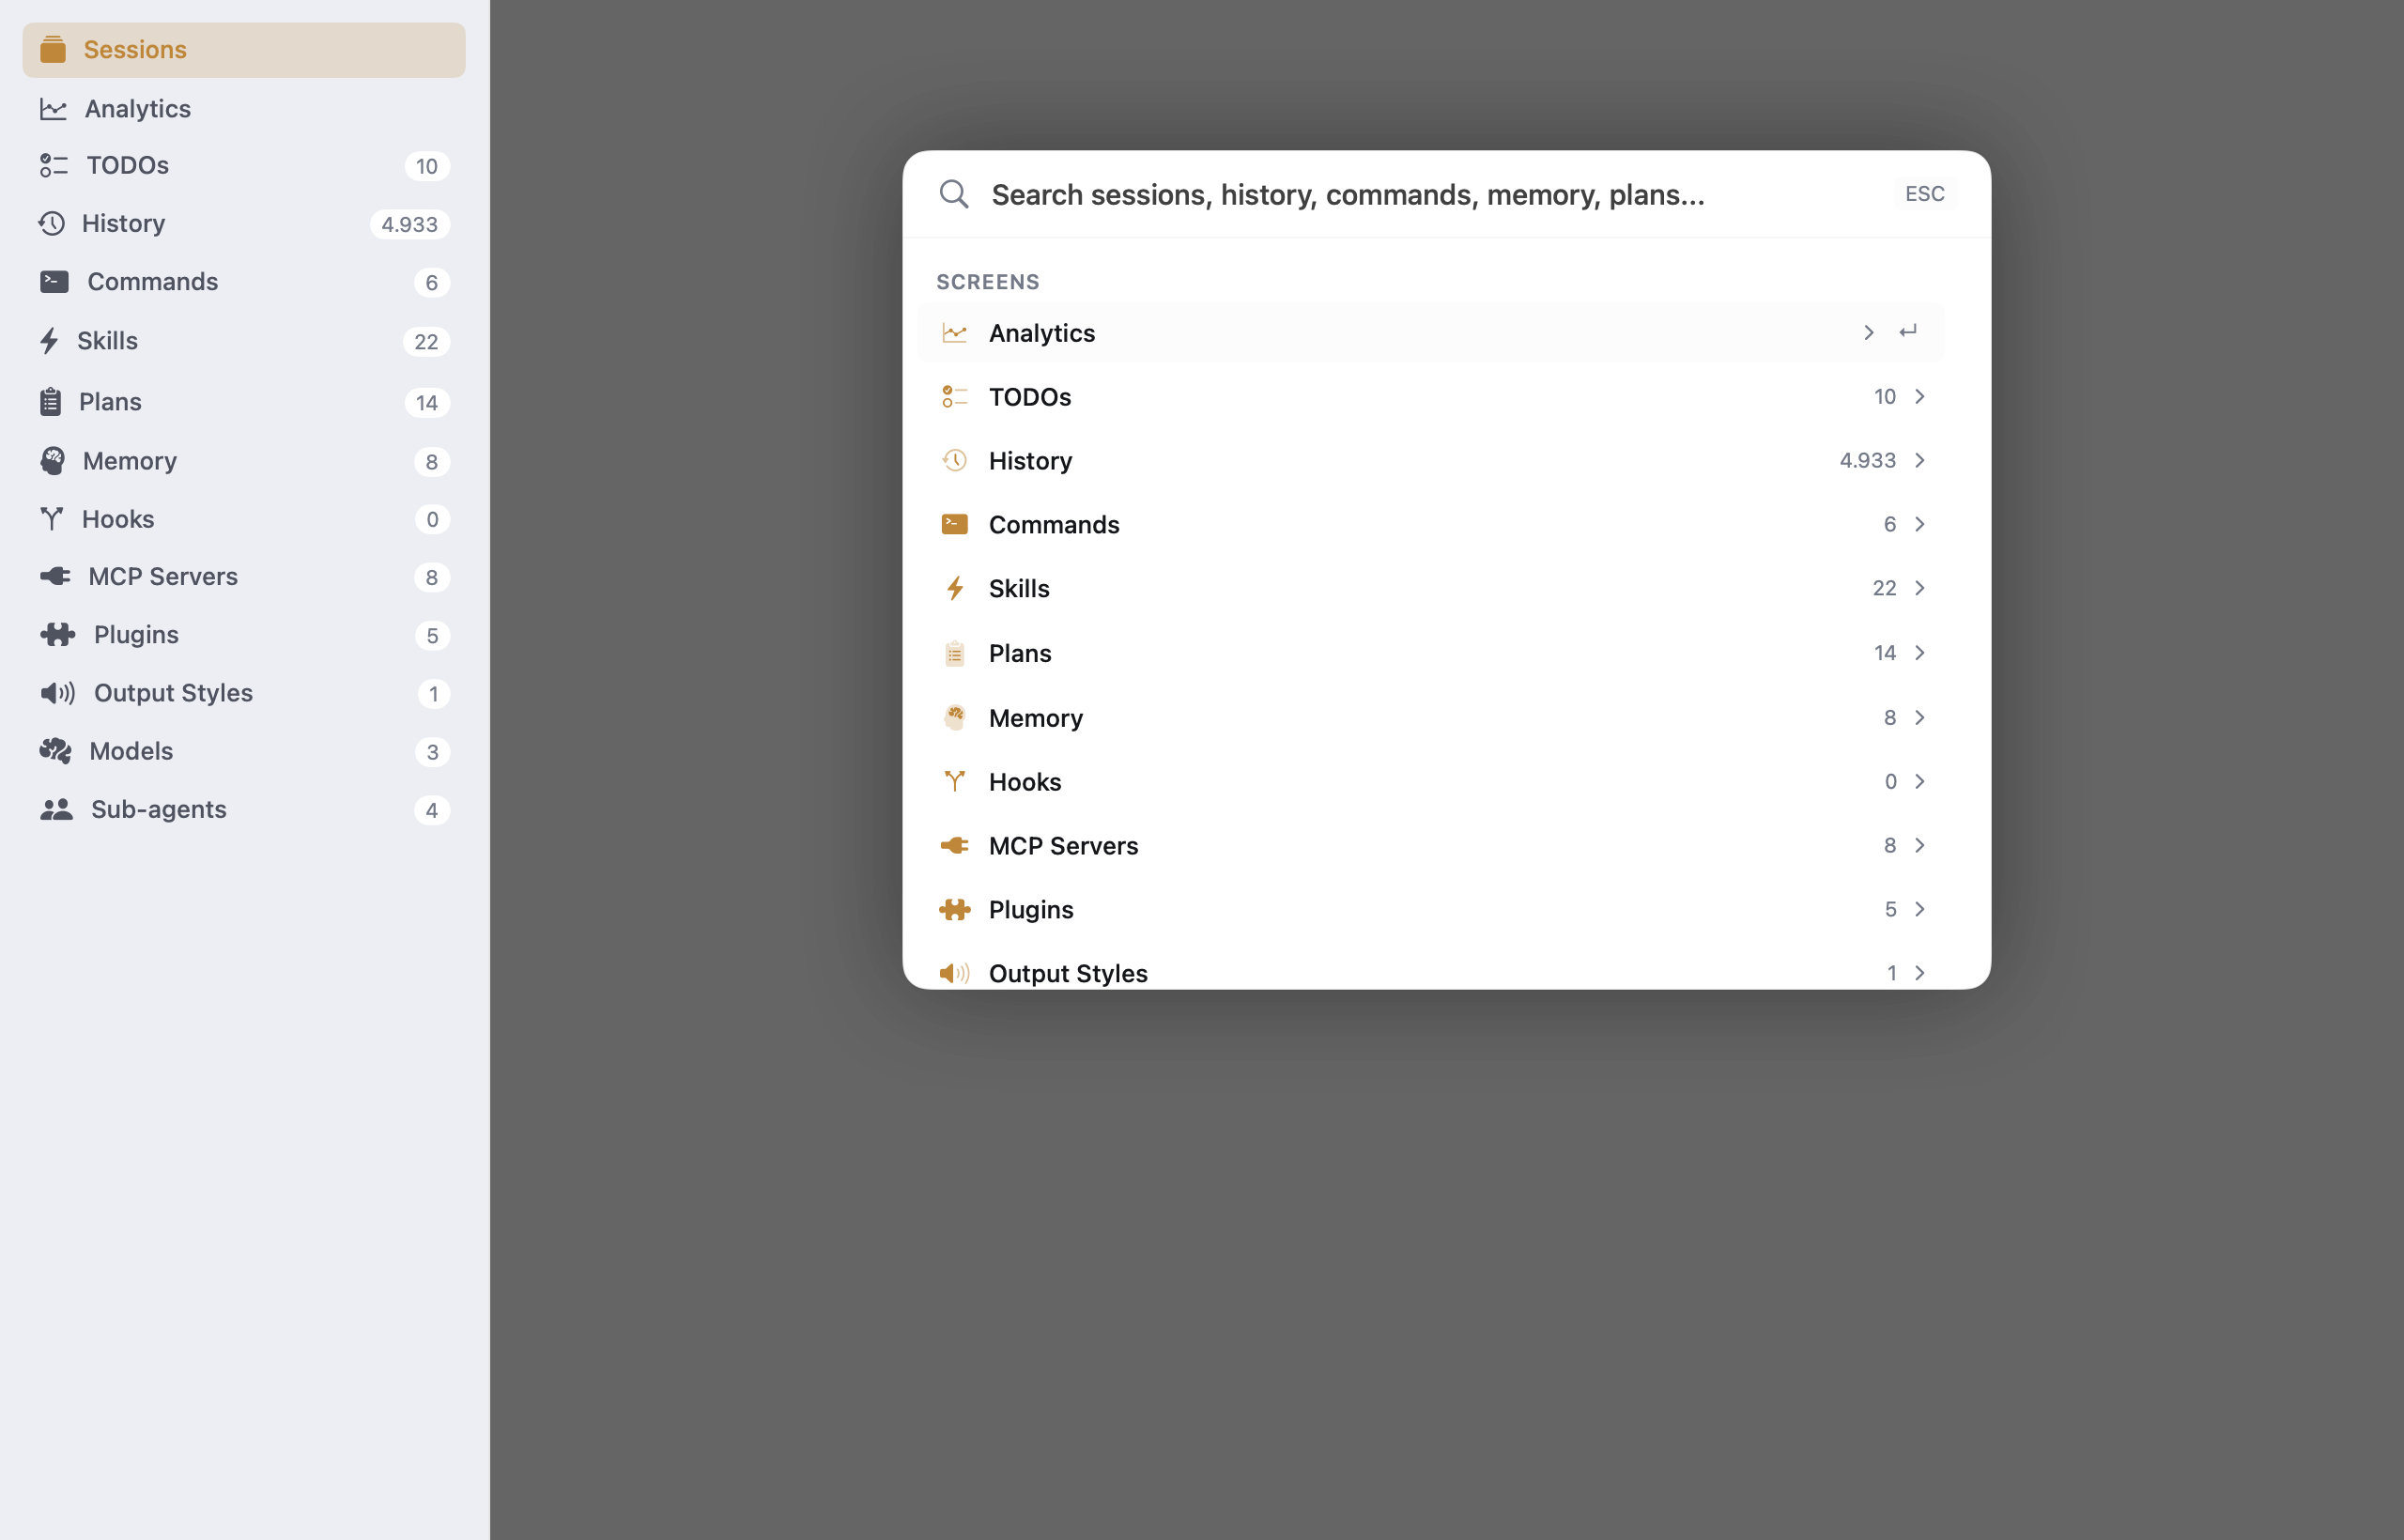
Search across all sessions, commands, plans, TODOs, and file paths. A spotlight-style overlay that gets you where you need to go.
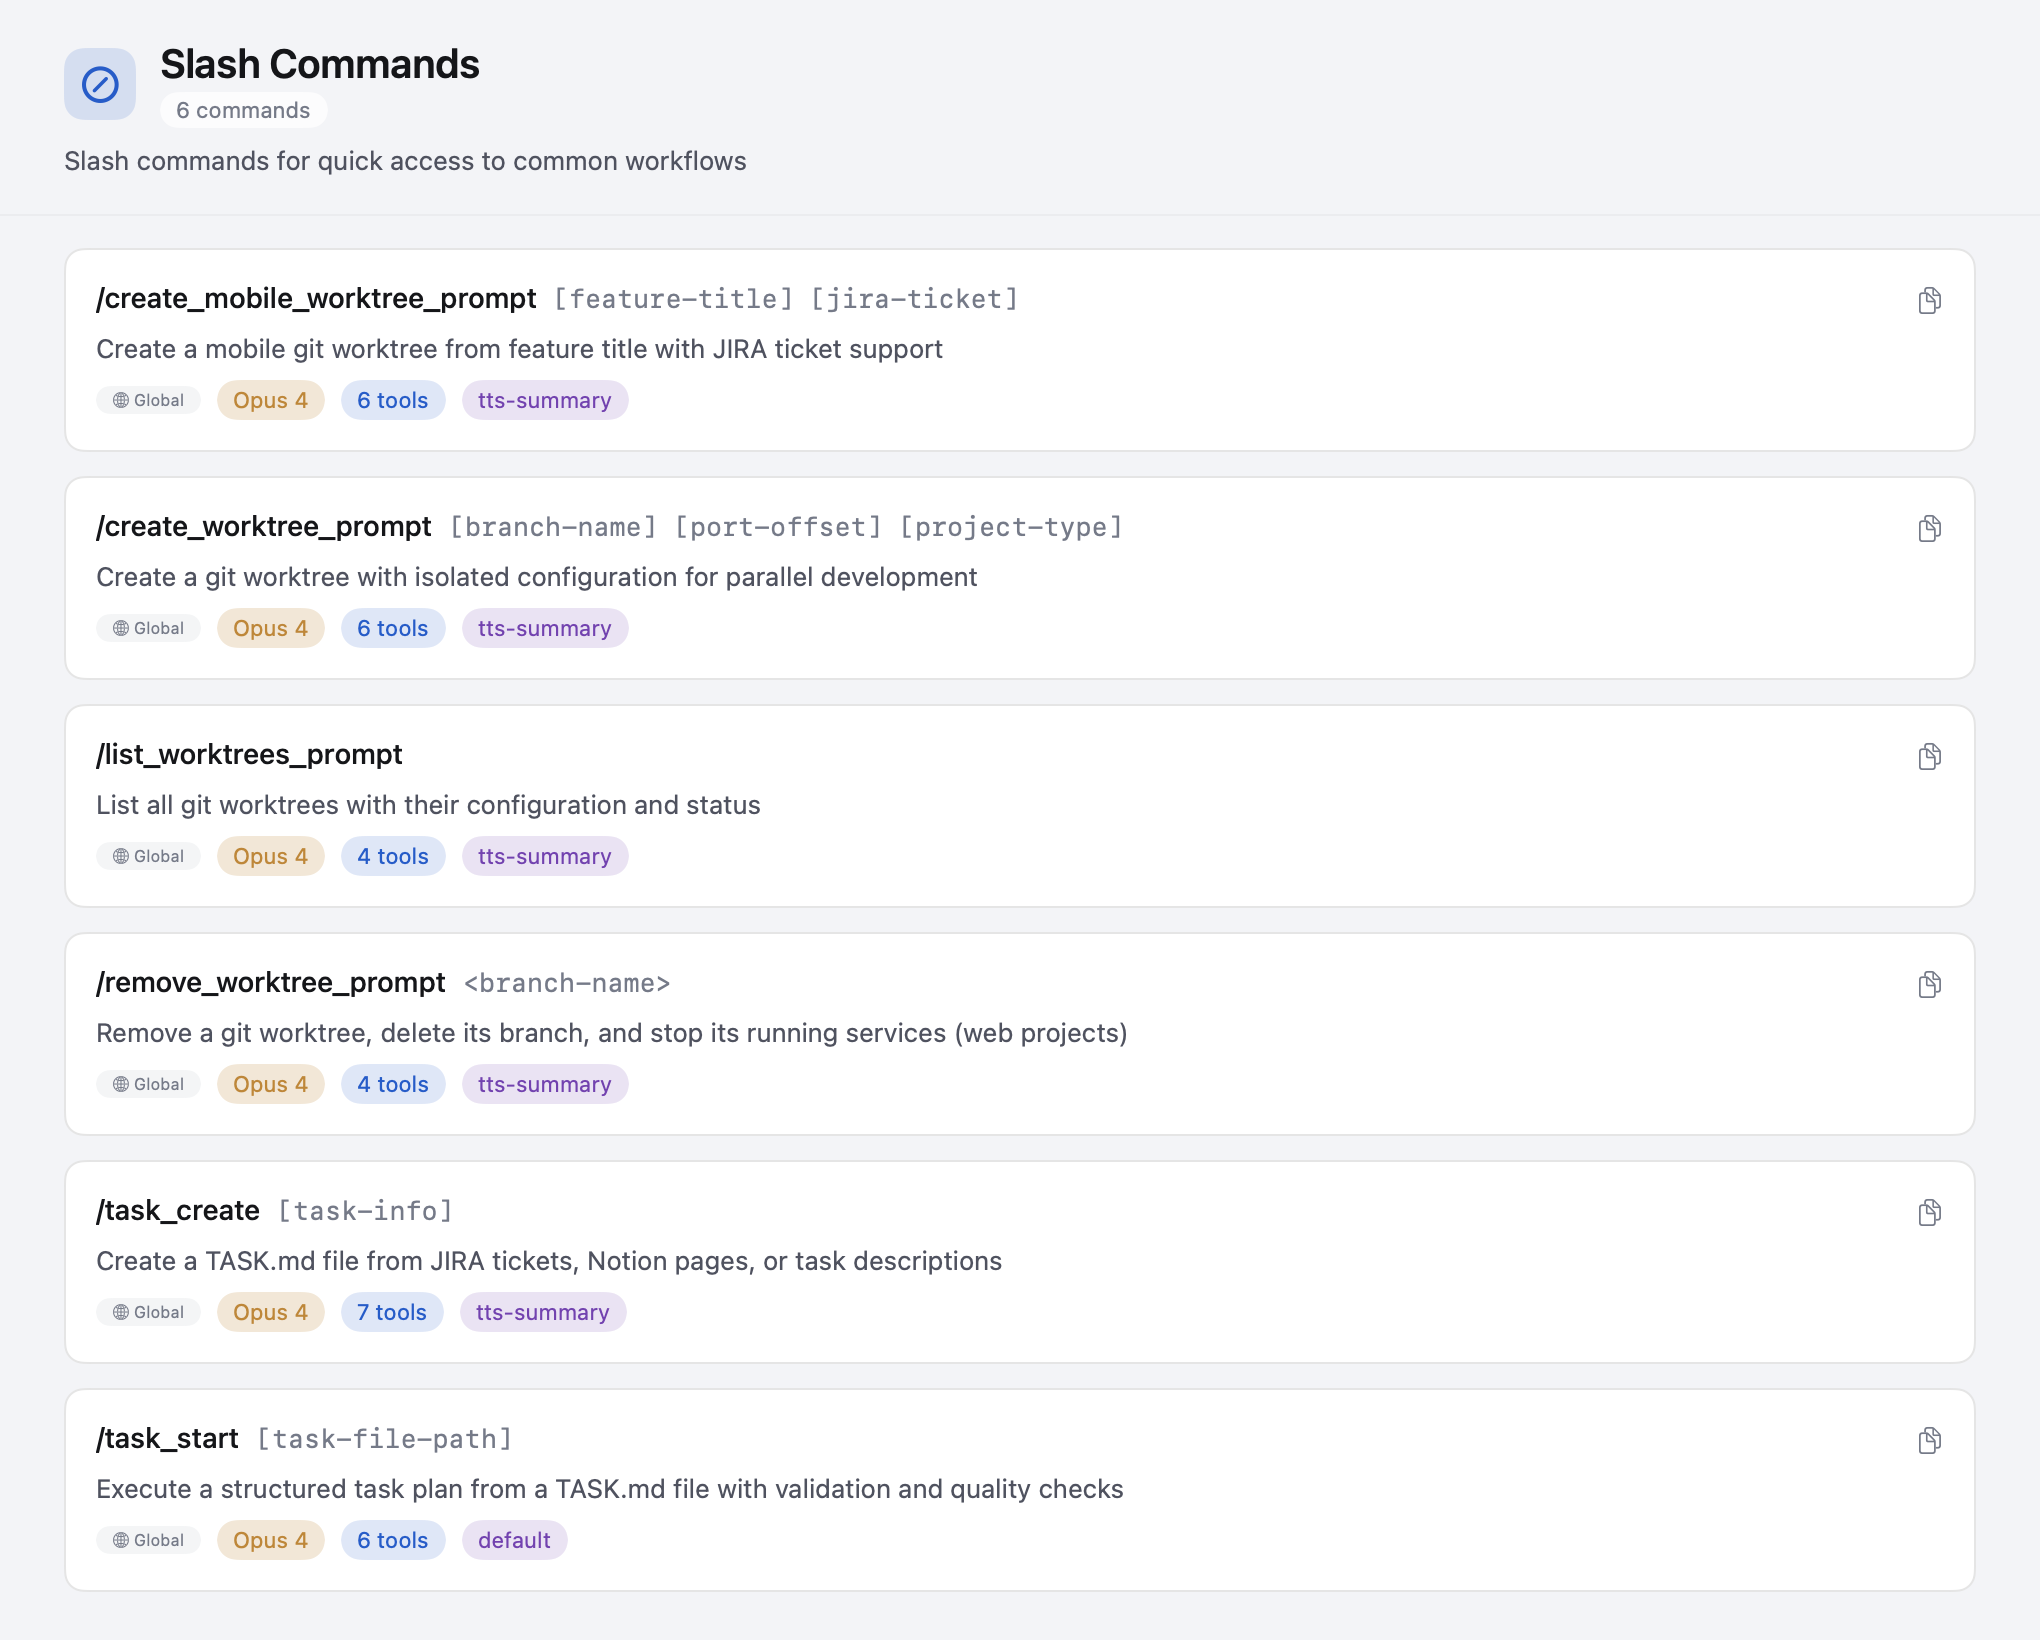
Browse and inspect all your slash commands — global ones from ~/.claude/commands/ and project-scoped ones from .claude/commands/. See descriptions, arguments, model assignments, and tool permissions at a glance.
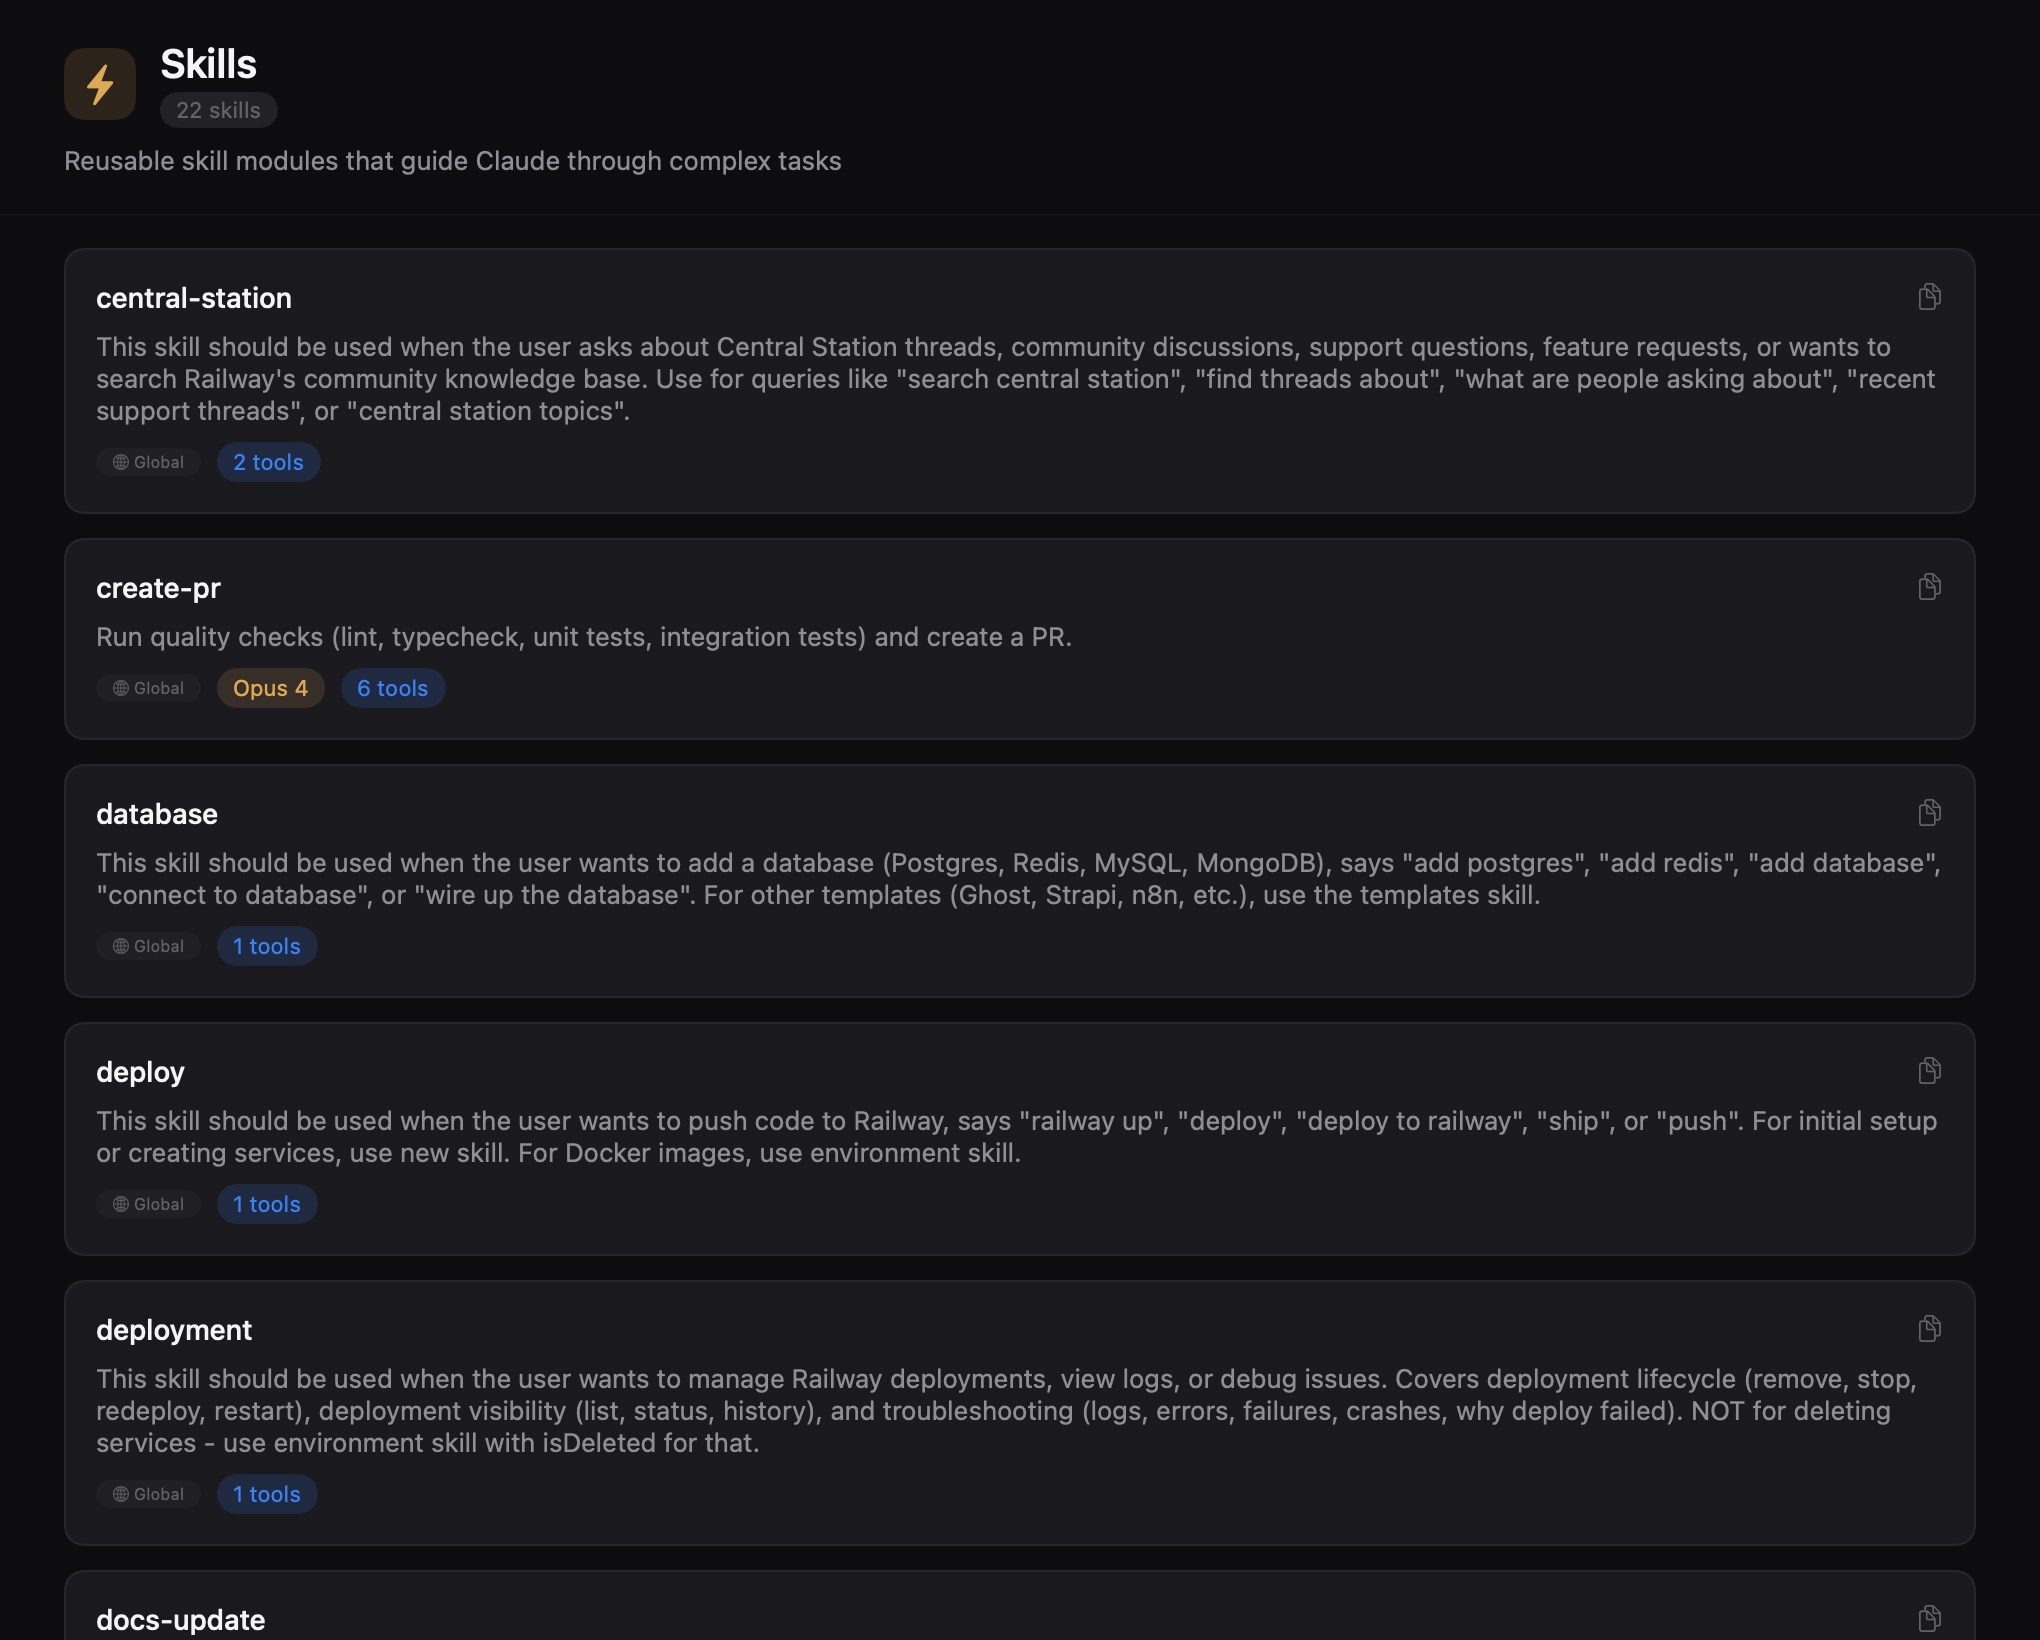
Explore reusable skill modules with their full documentation. Skills are rendered with markdown frontmatter parsed into structured cards showing descriptions and references.
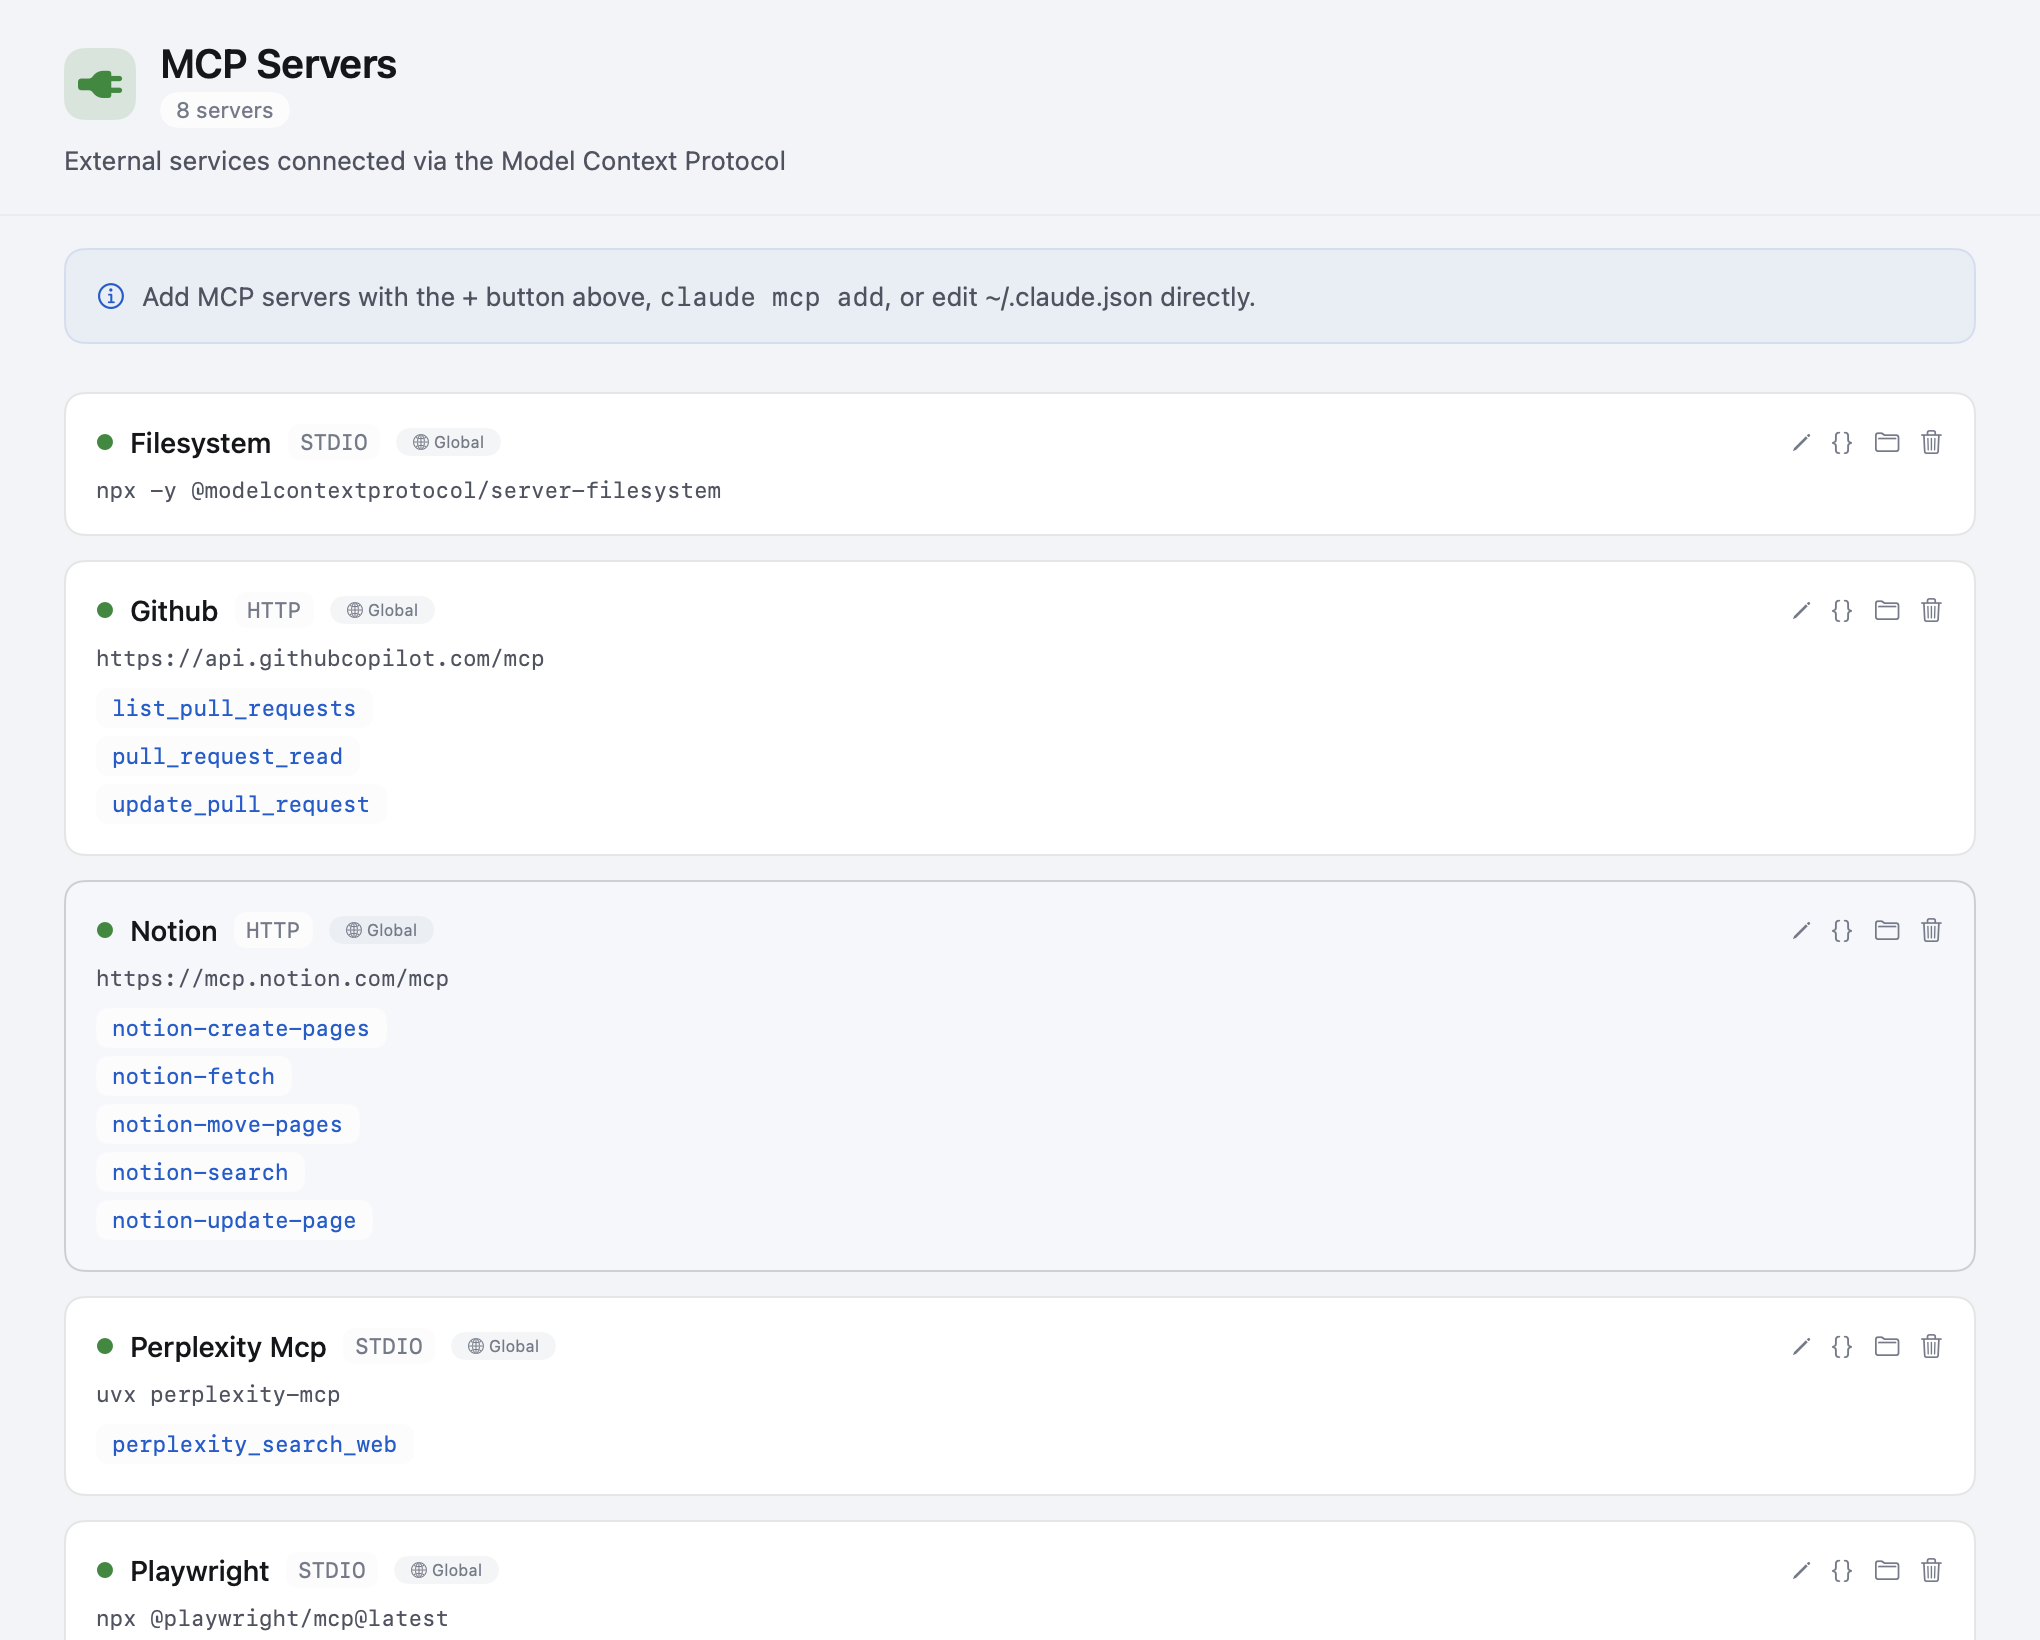
See all configured Model Context Protocol servers with their connection details, tool counts, and scope badges. Quickly check which servers are available globally vs. per-project.
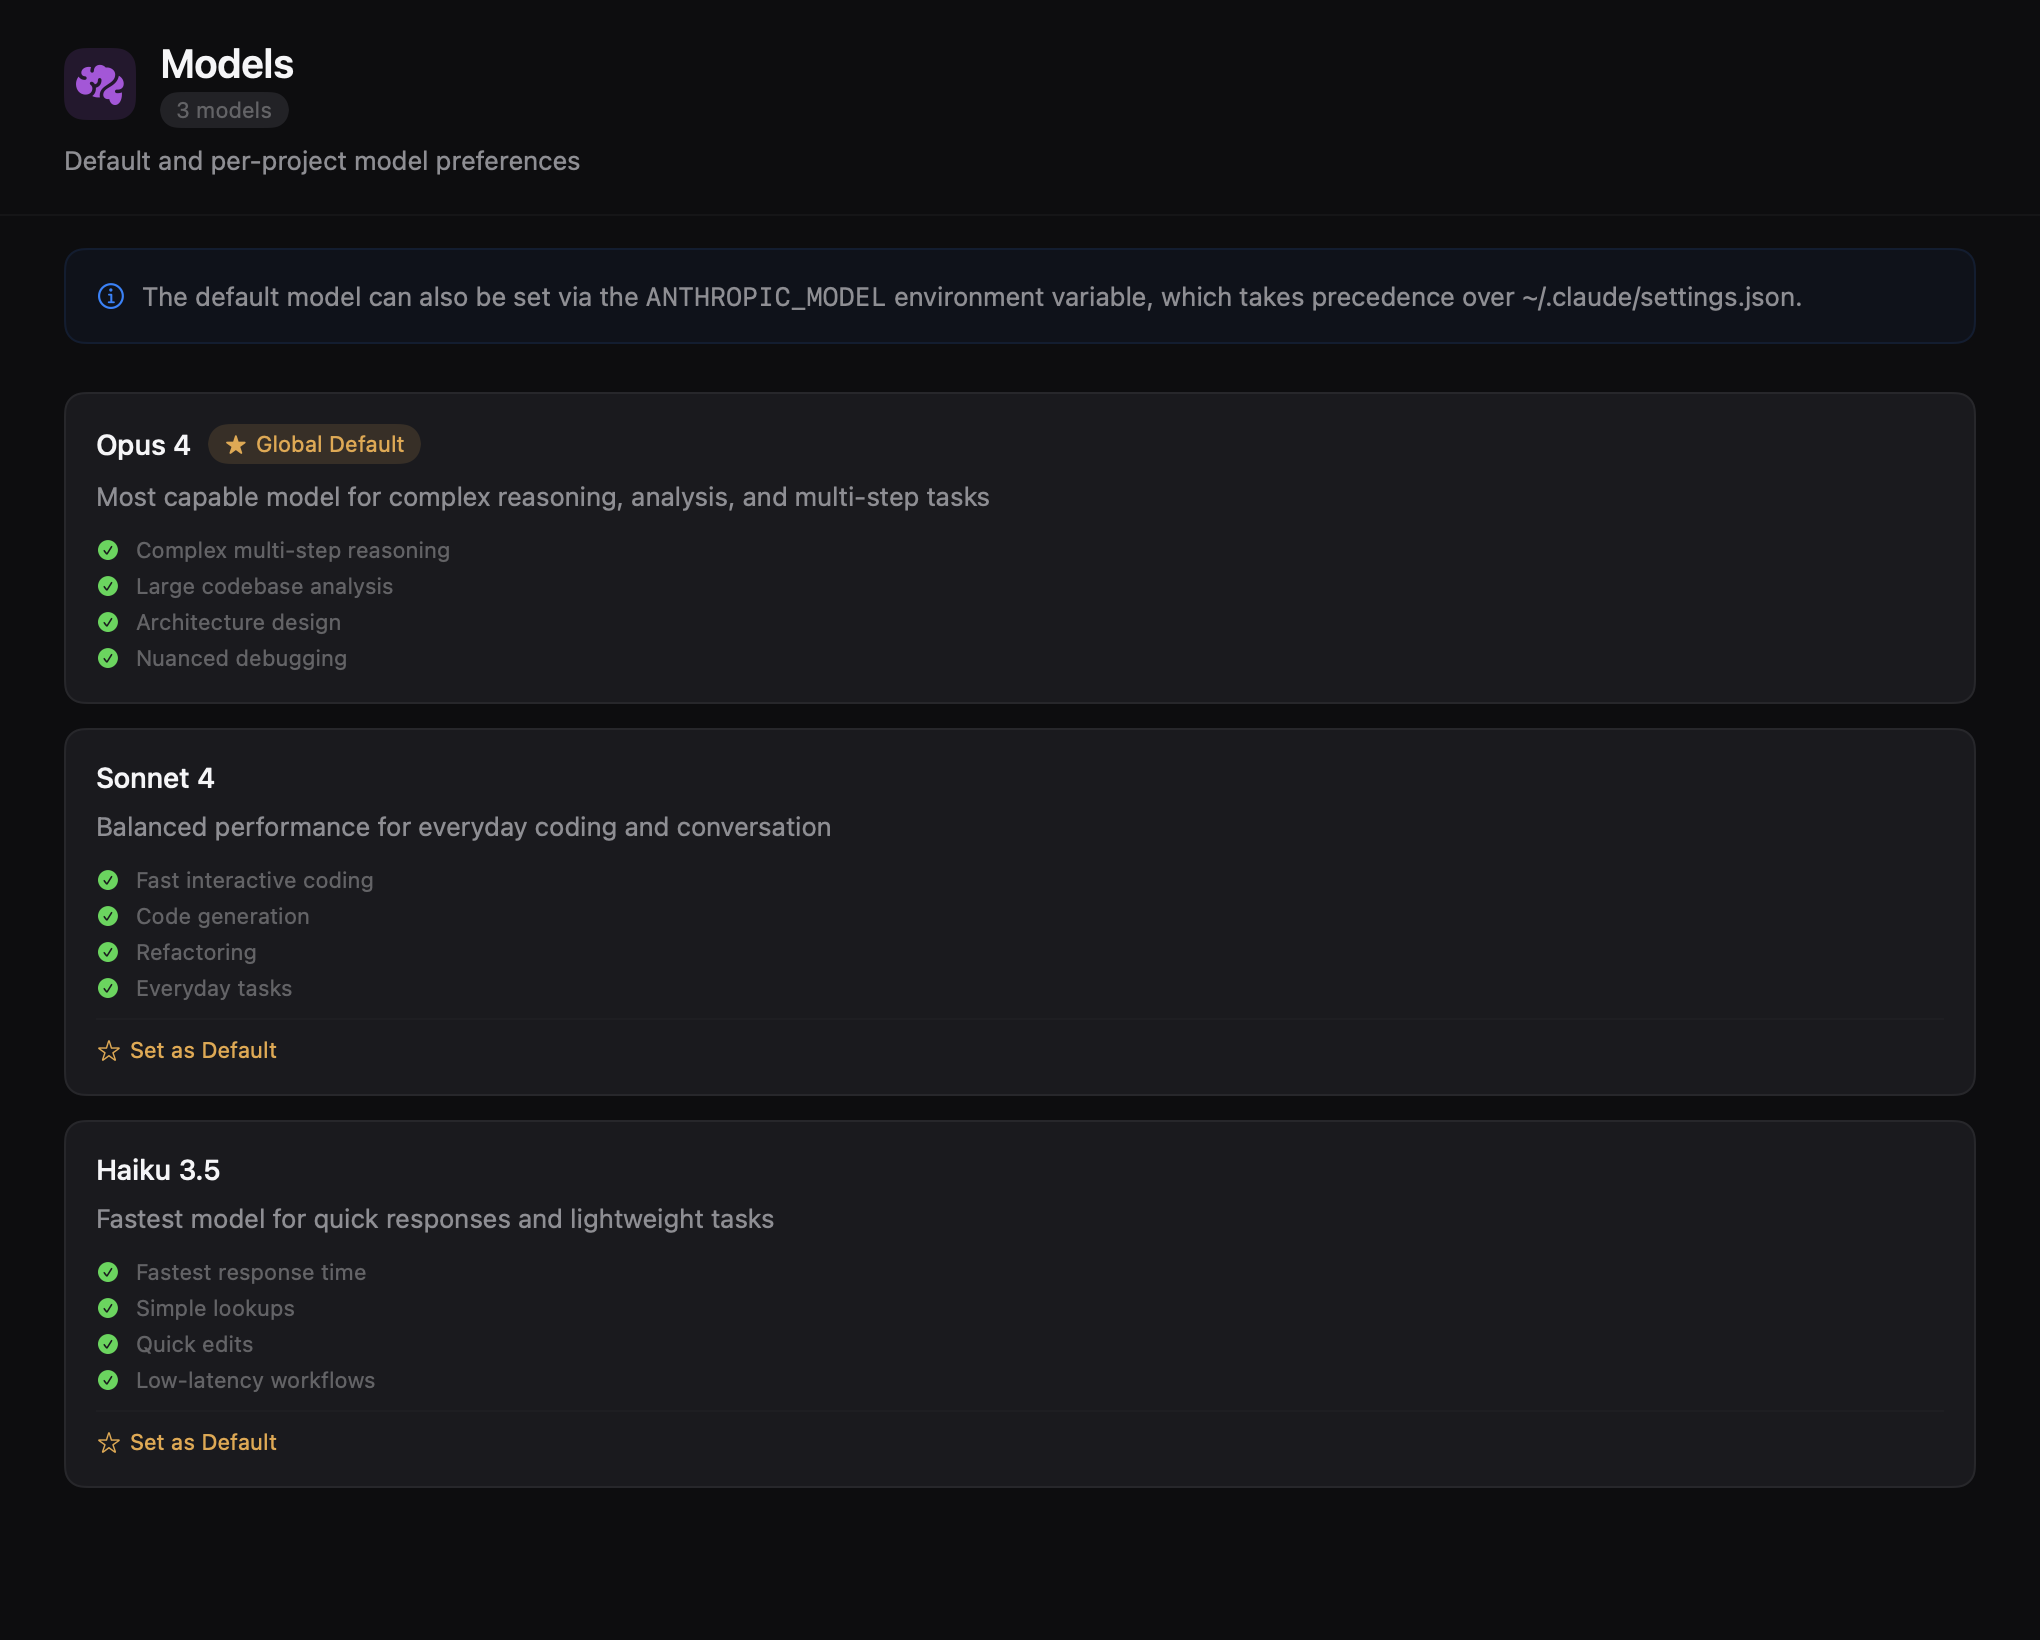
Browse all available models with their capabilities. See which model is set as the default and compare options across providers.
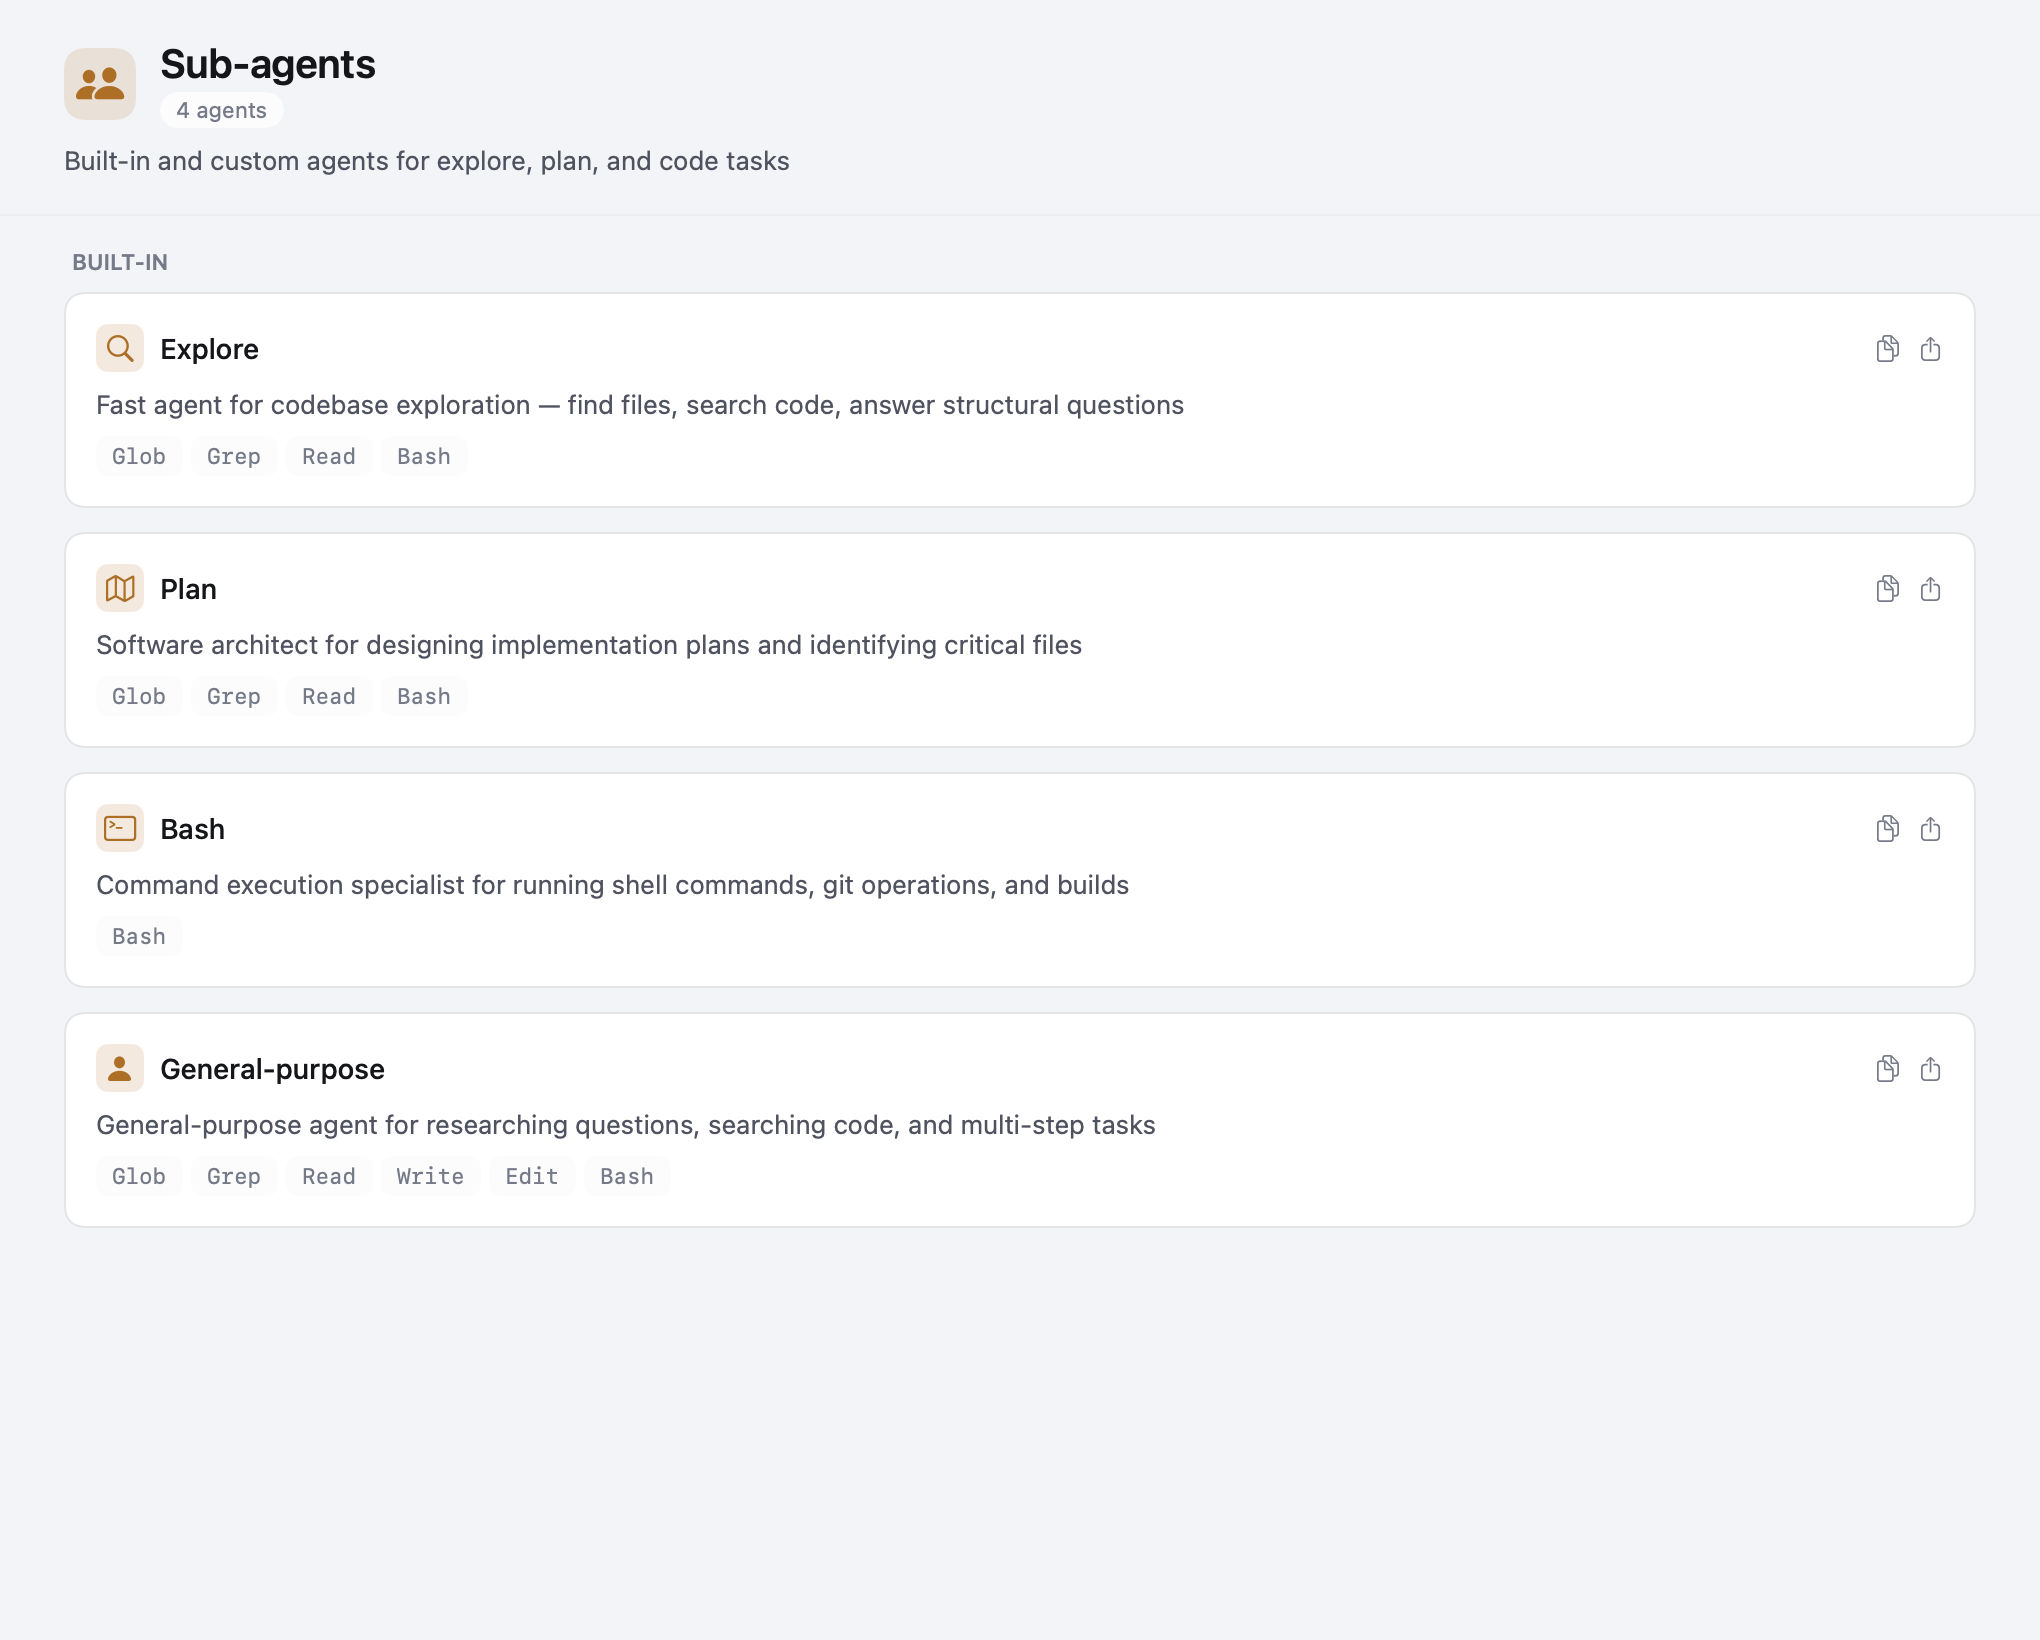
Inspect built-in sub-agent configurations. See agent names, descriptions, and how they're wired into your workflow.
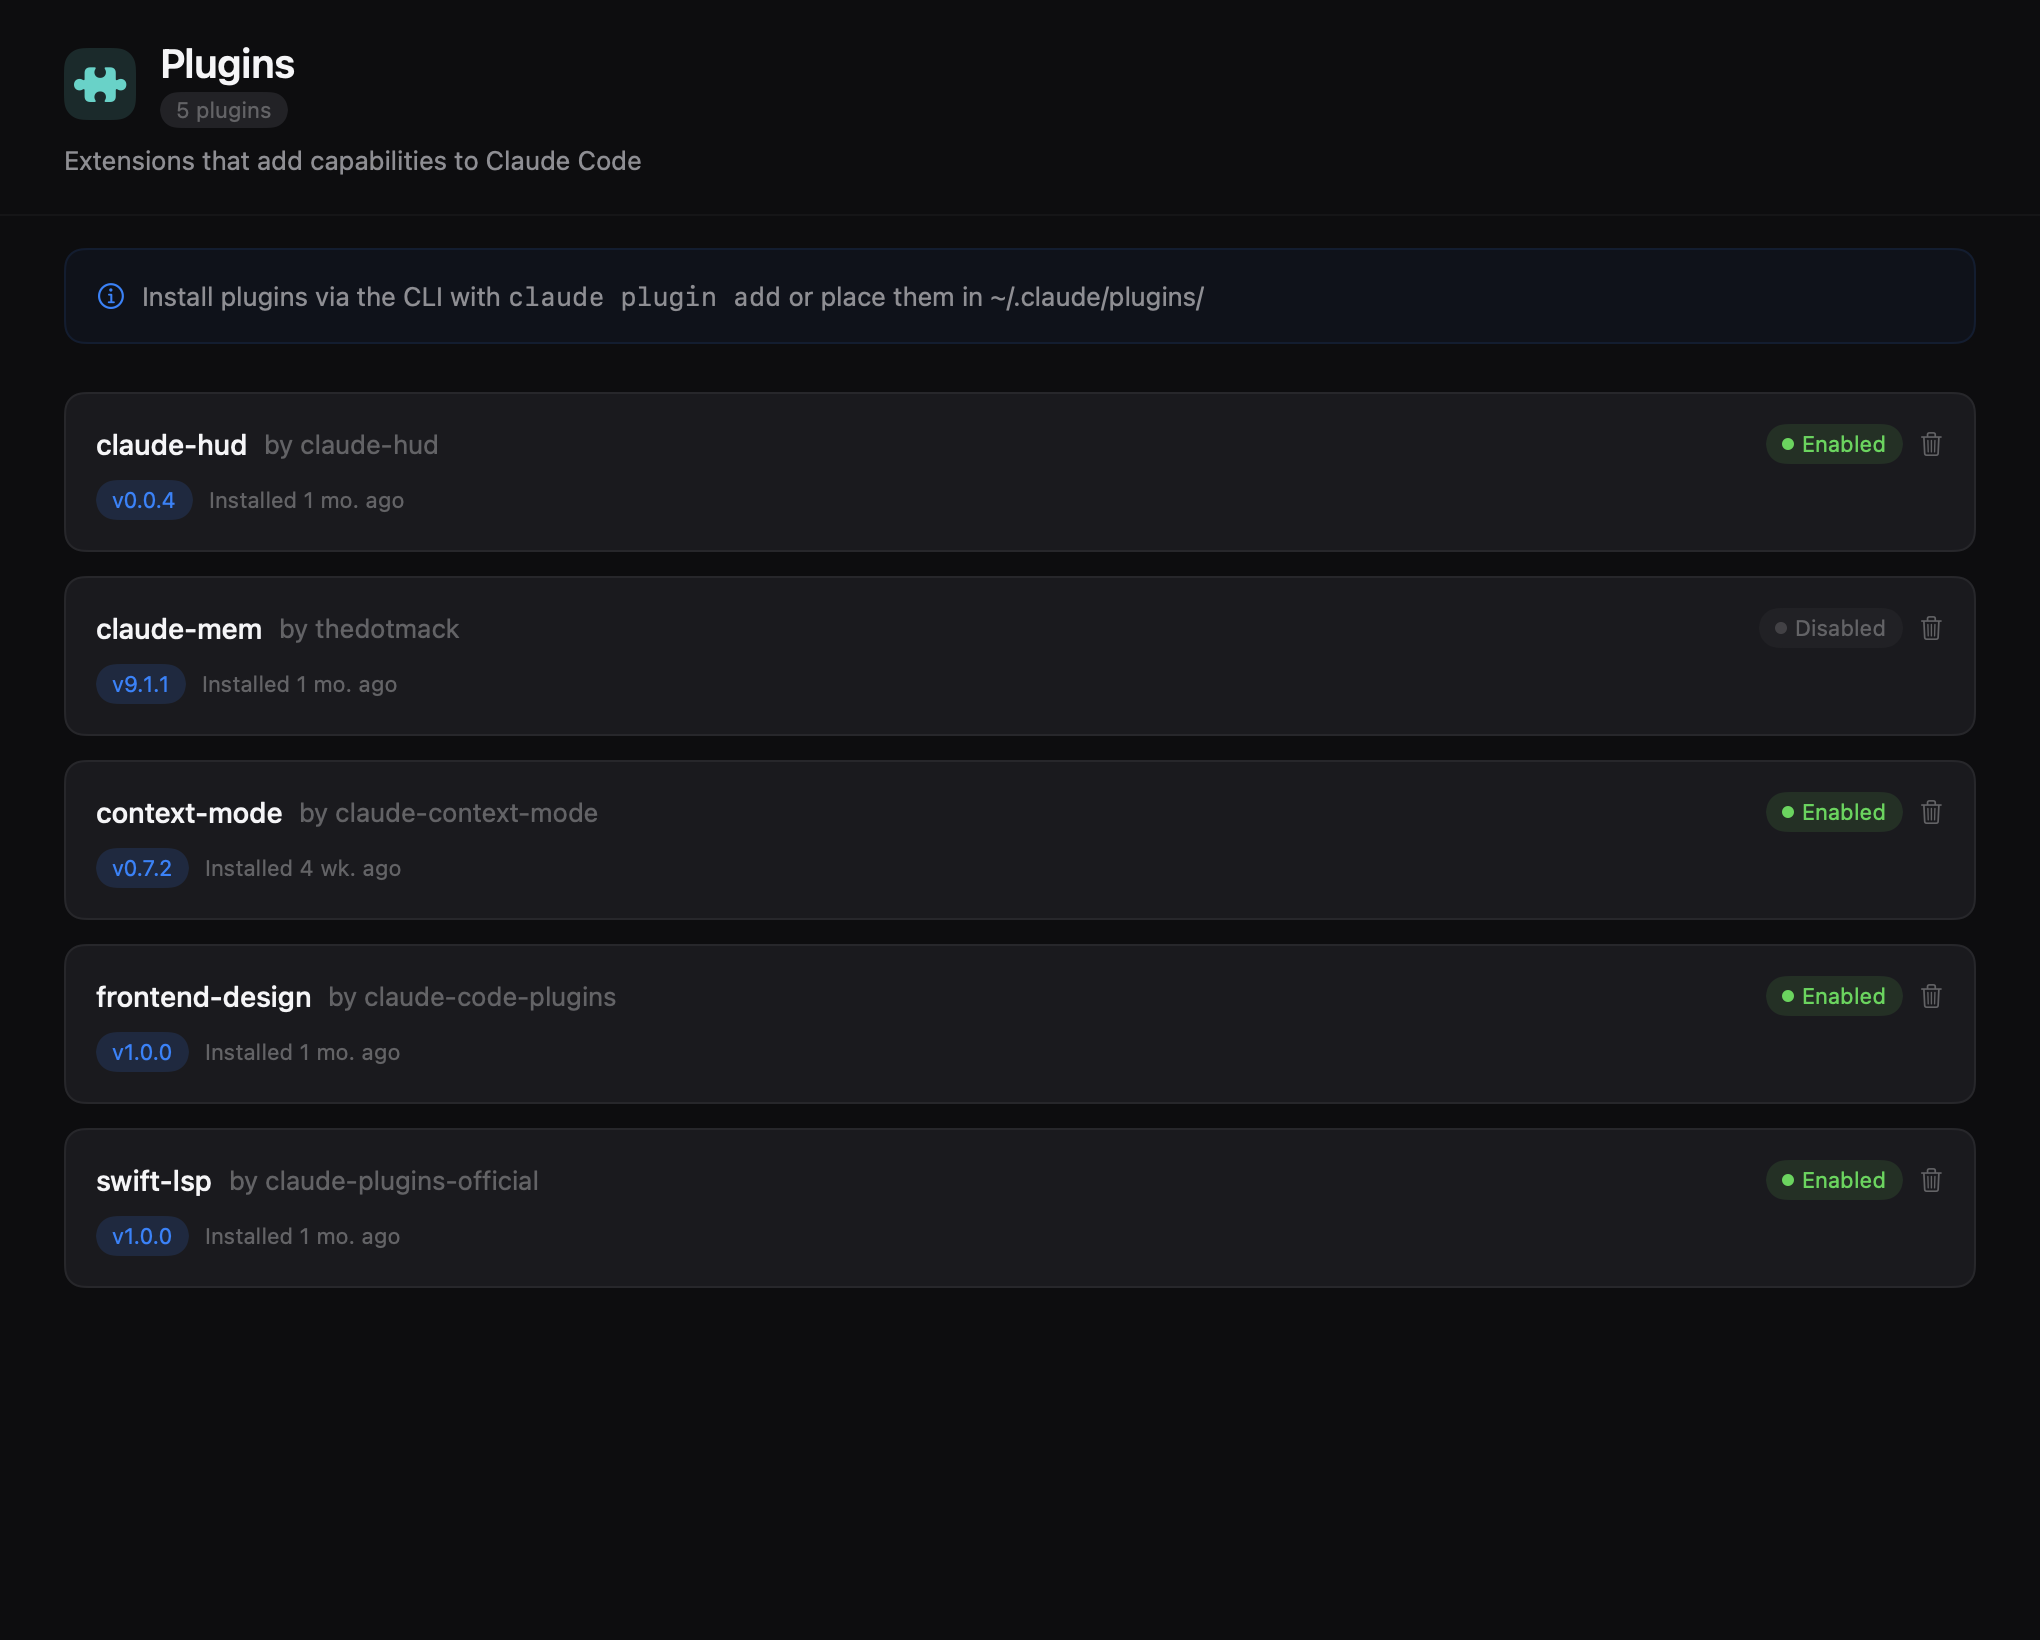
View all installed Claude plugins with their metadata. Check what's active, discover available extensions, and see plugin details at a glance.
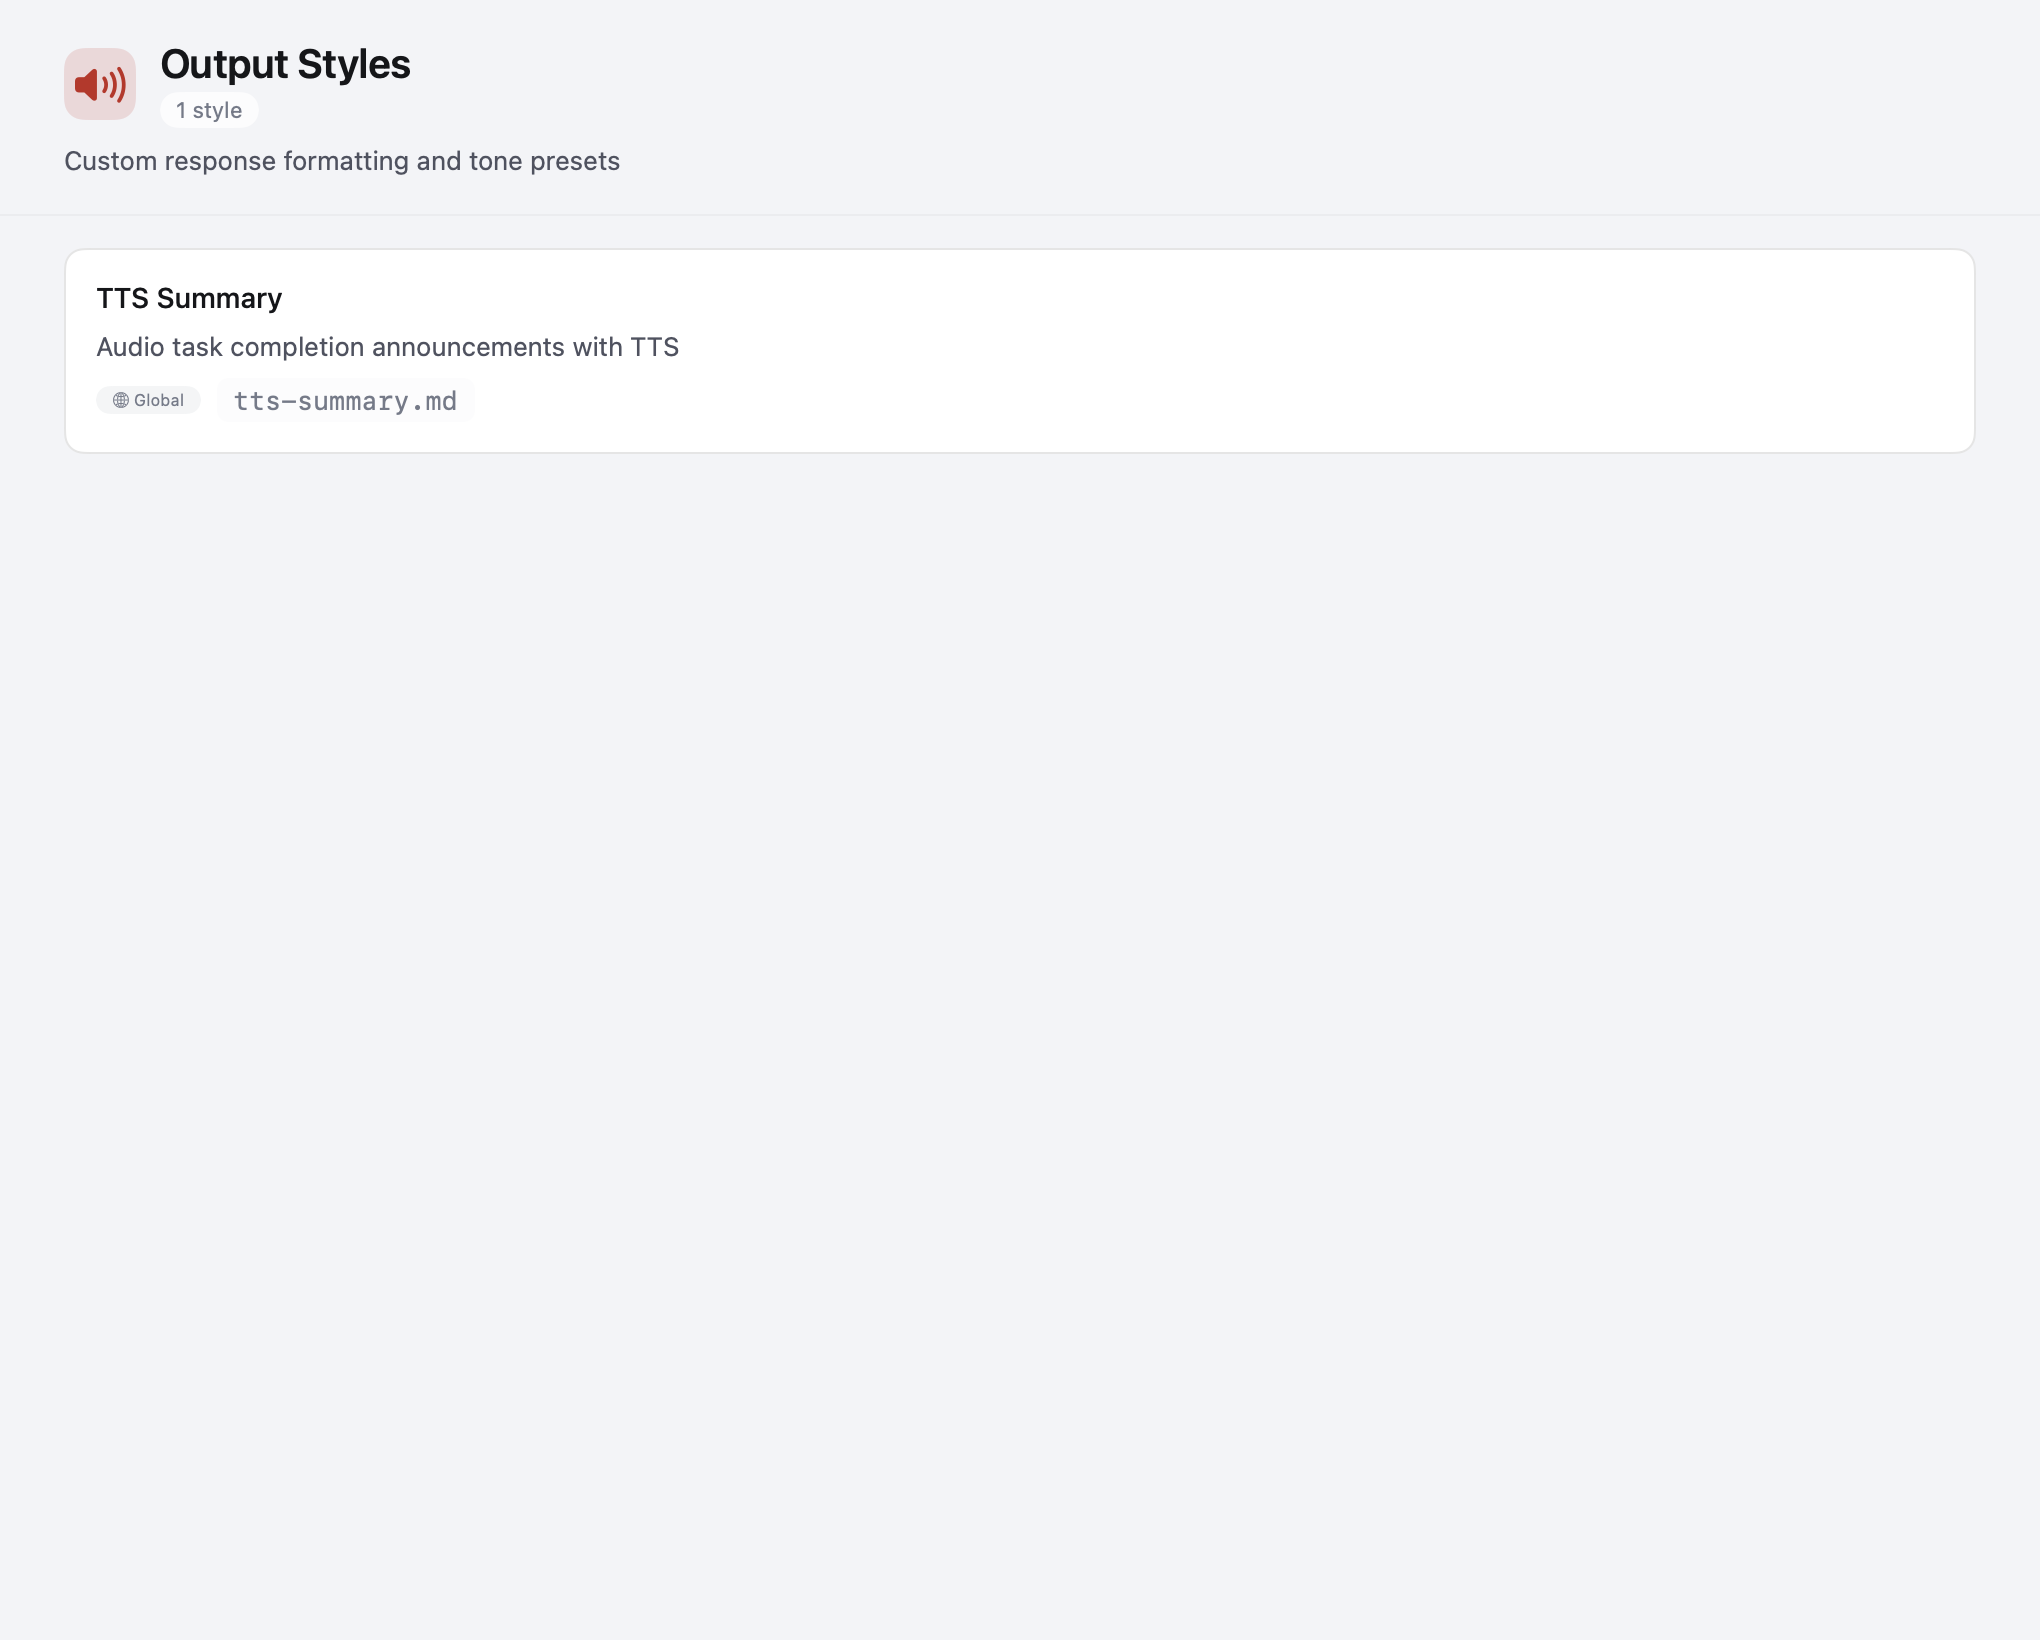
Browse and preview output formatting styles. See how each style shapes Claude's responses and which one is currently active.
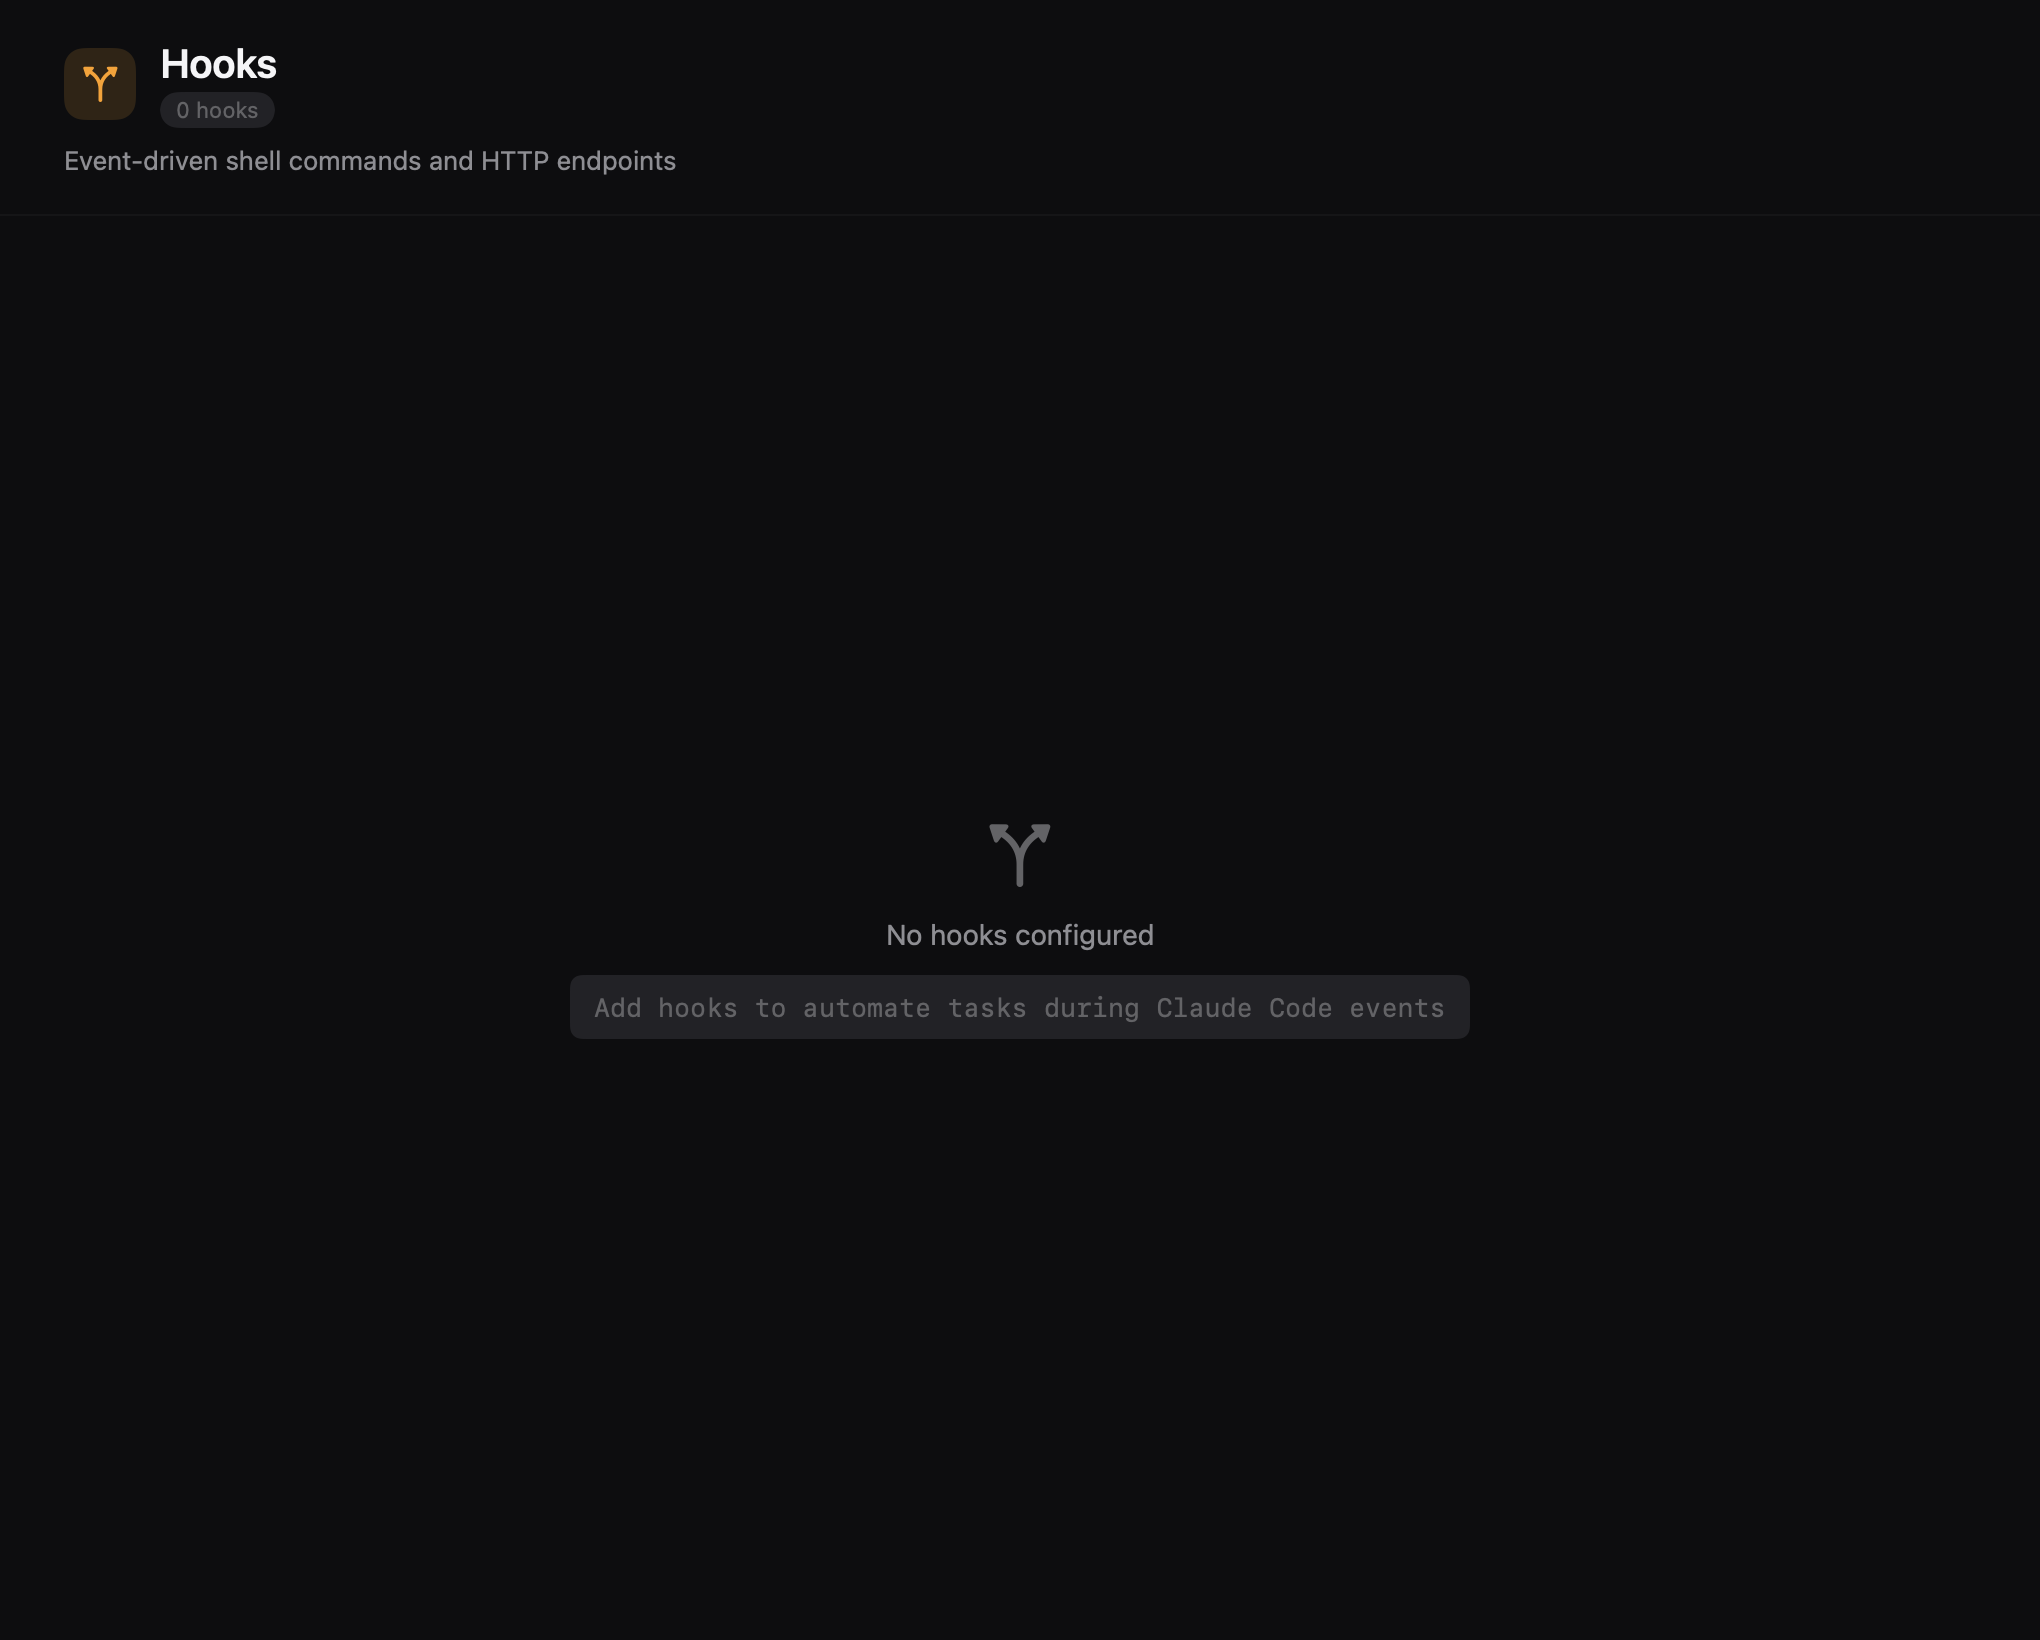
View and manage hooks that automate tasks during Claude Code events. See all configured hooks grouped by event type — PreToolUse, PostToolUse, Notification, and more — with matcher patterns, handler types, timeout badges, and scope indicators.
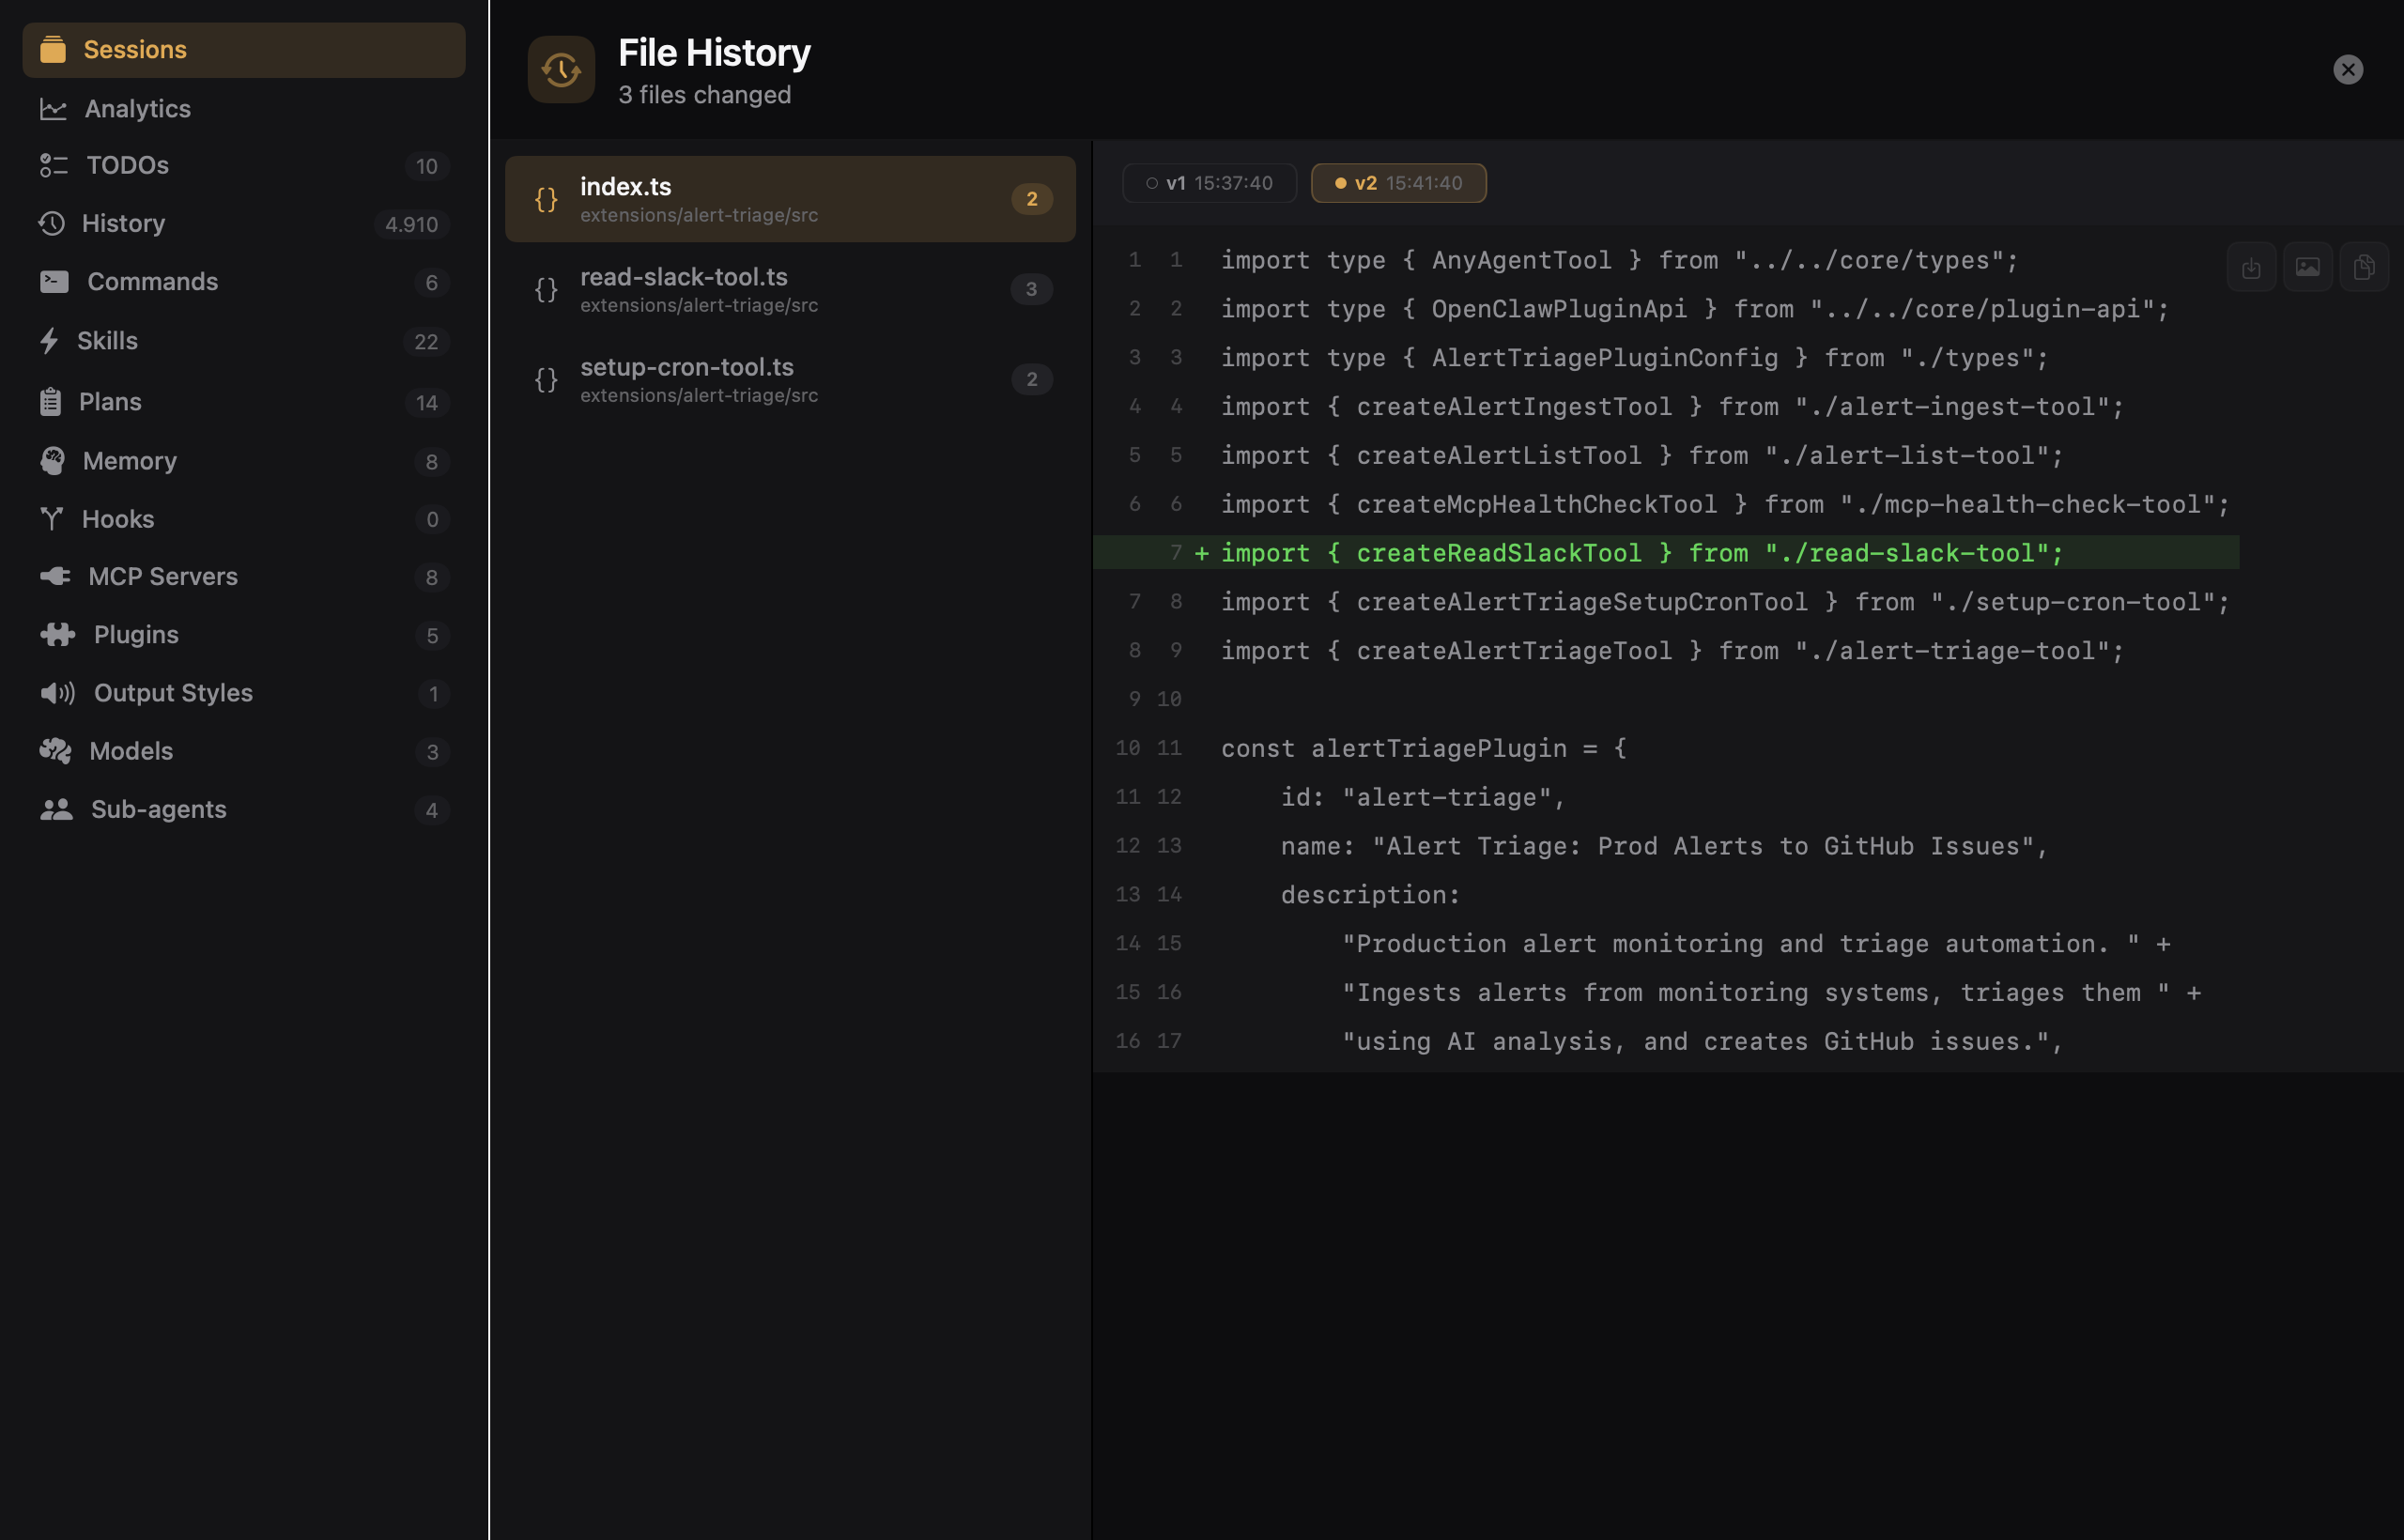
Browse versioned file snapshots captured during Claude Code sessions. See all modified files with version timelines, and inspect diffs between each version to understand exactly what changed and when.
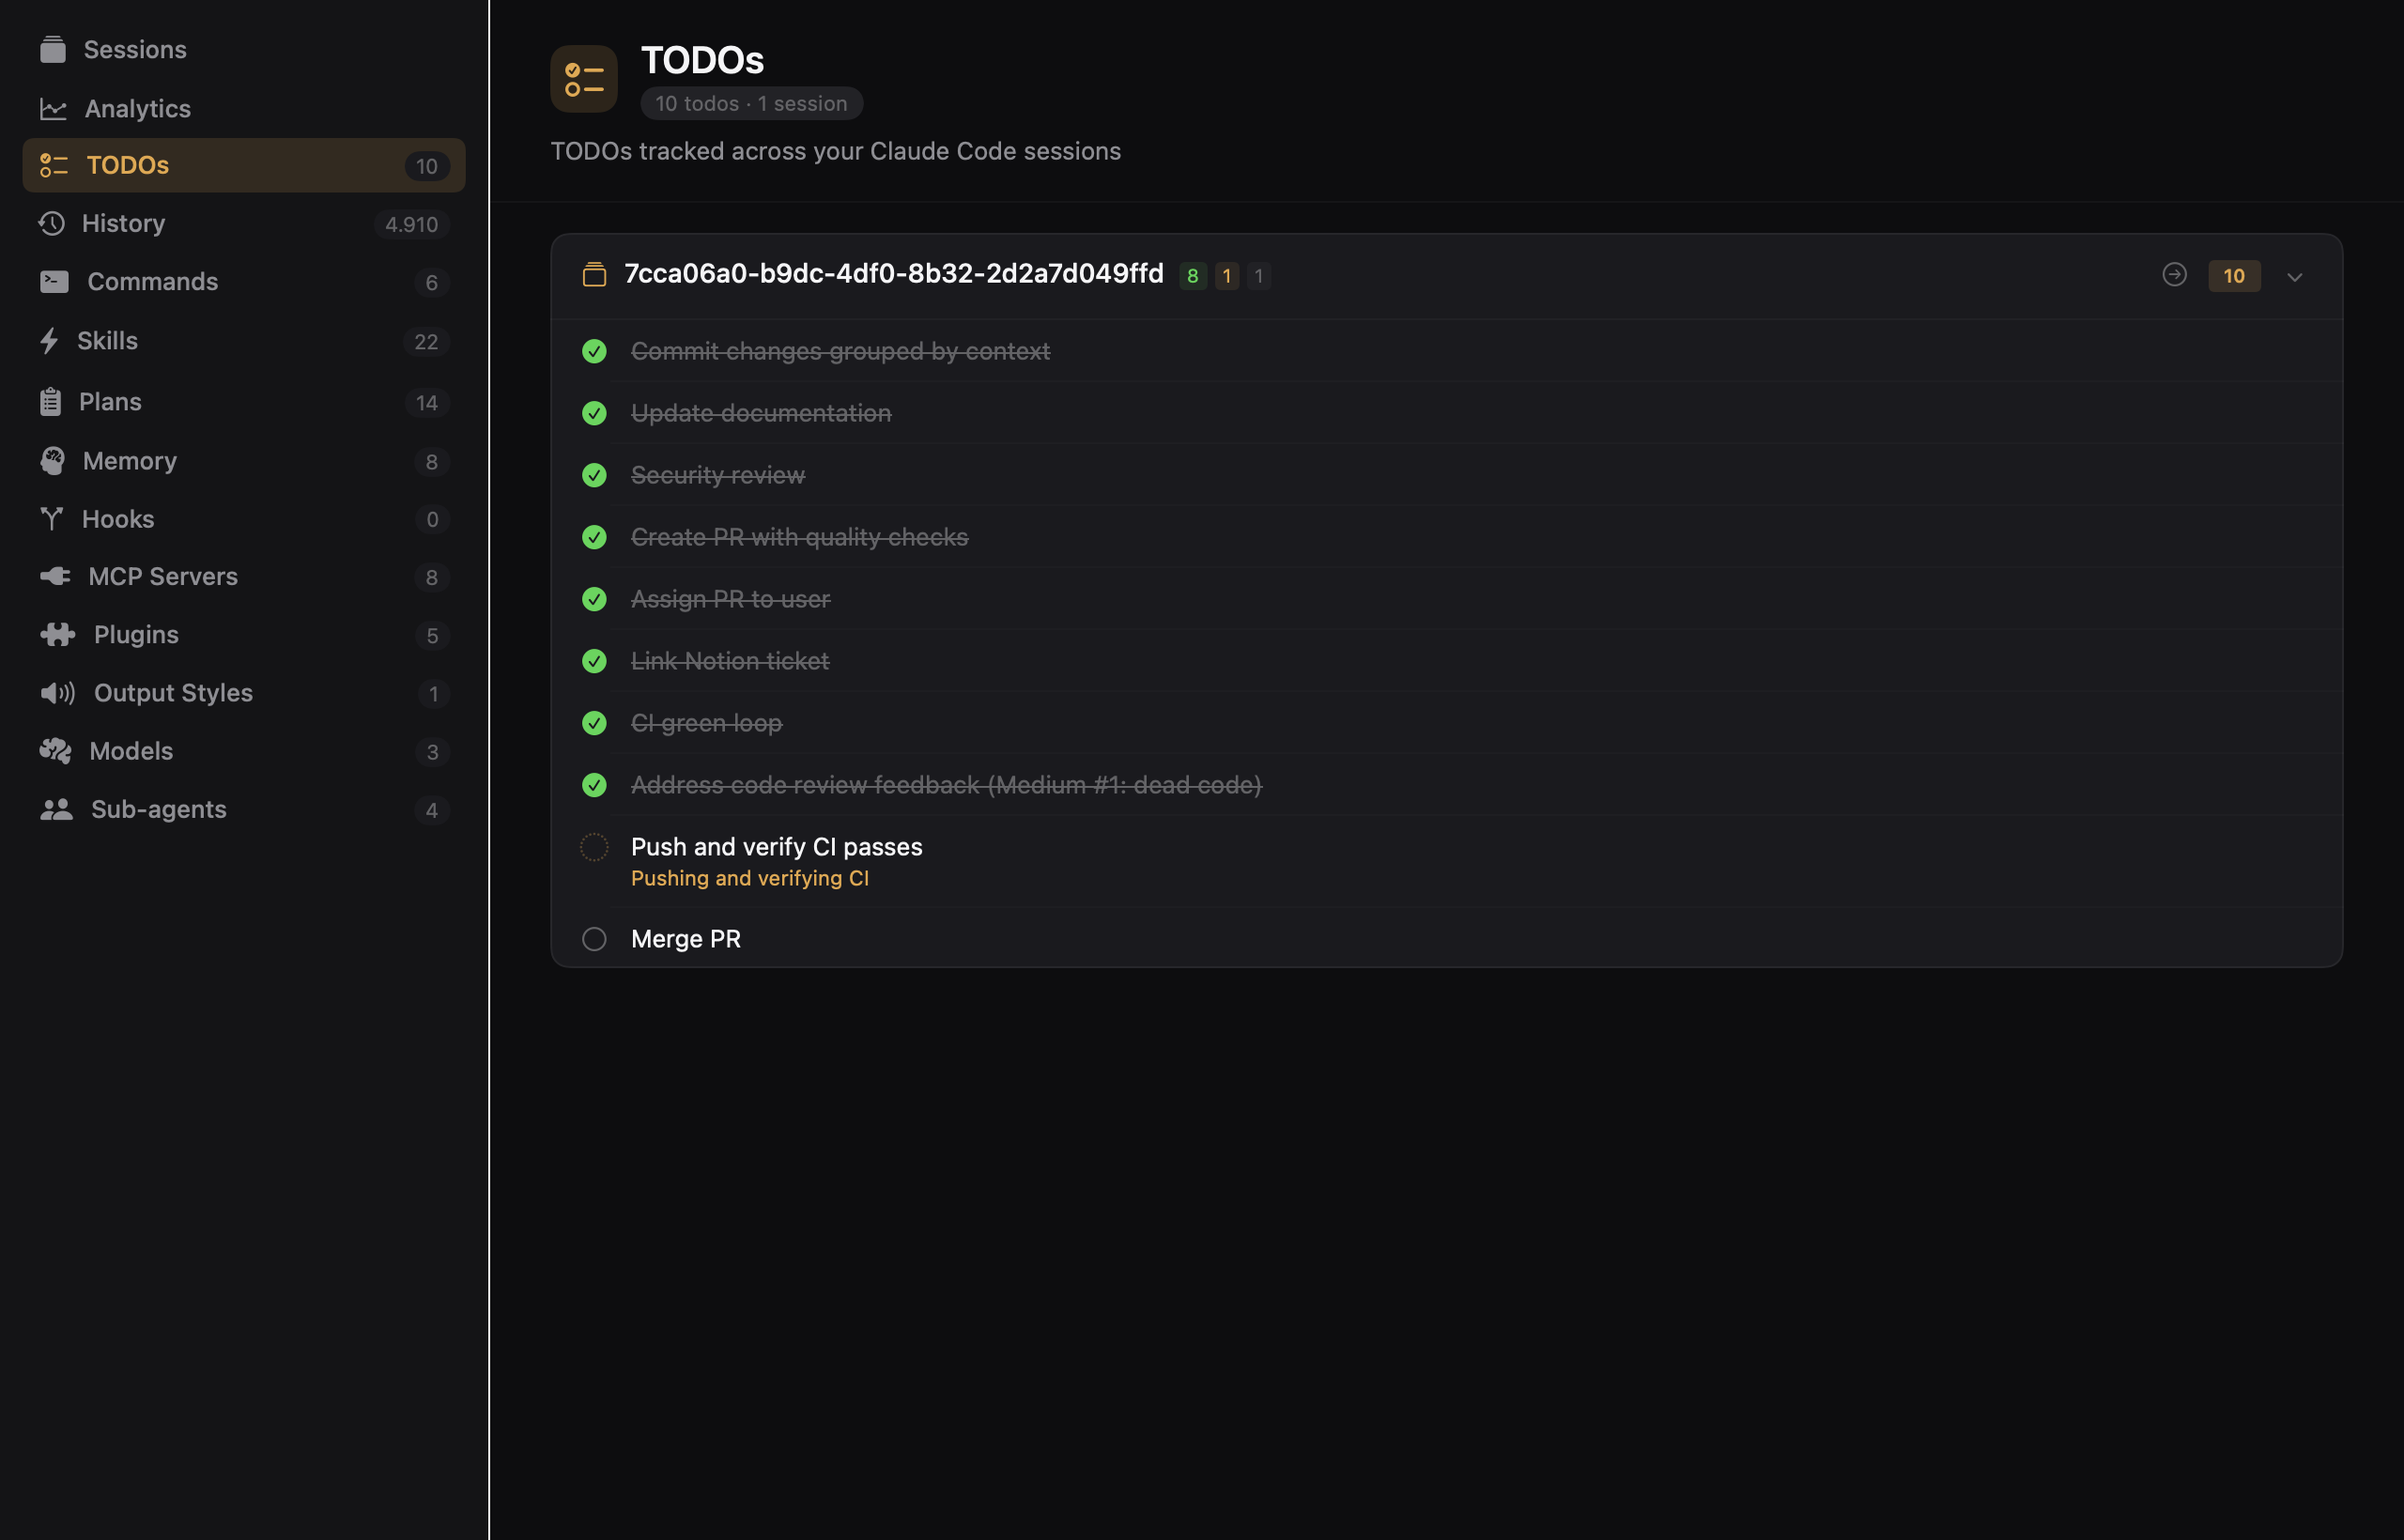
Track all your Claude Code session TODOs in one place. See pending, in-progress, and completed tasks grouped by session, with inline status badges and quick navigation back to the originating conversation.
Browse, preview, and manage your Claude Code plans from ~/.claude/plans/. Full markdown rendering with raw toggle, copy-to-clipboard, delete actions, and fuzzy search across all plan content.

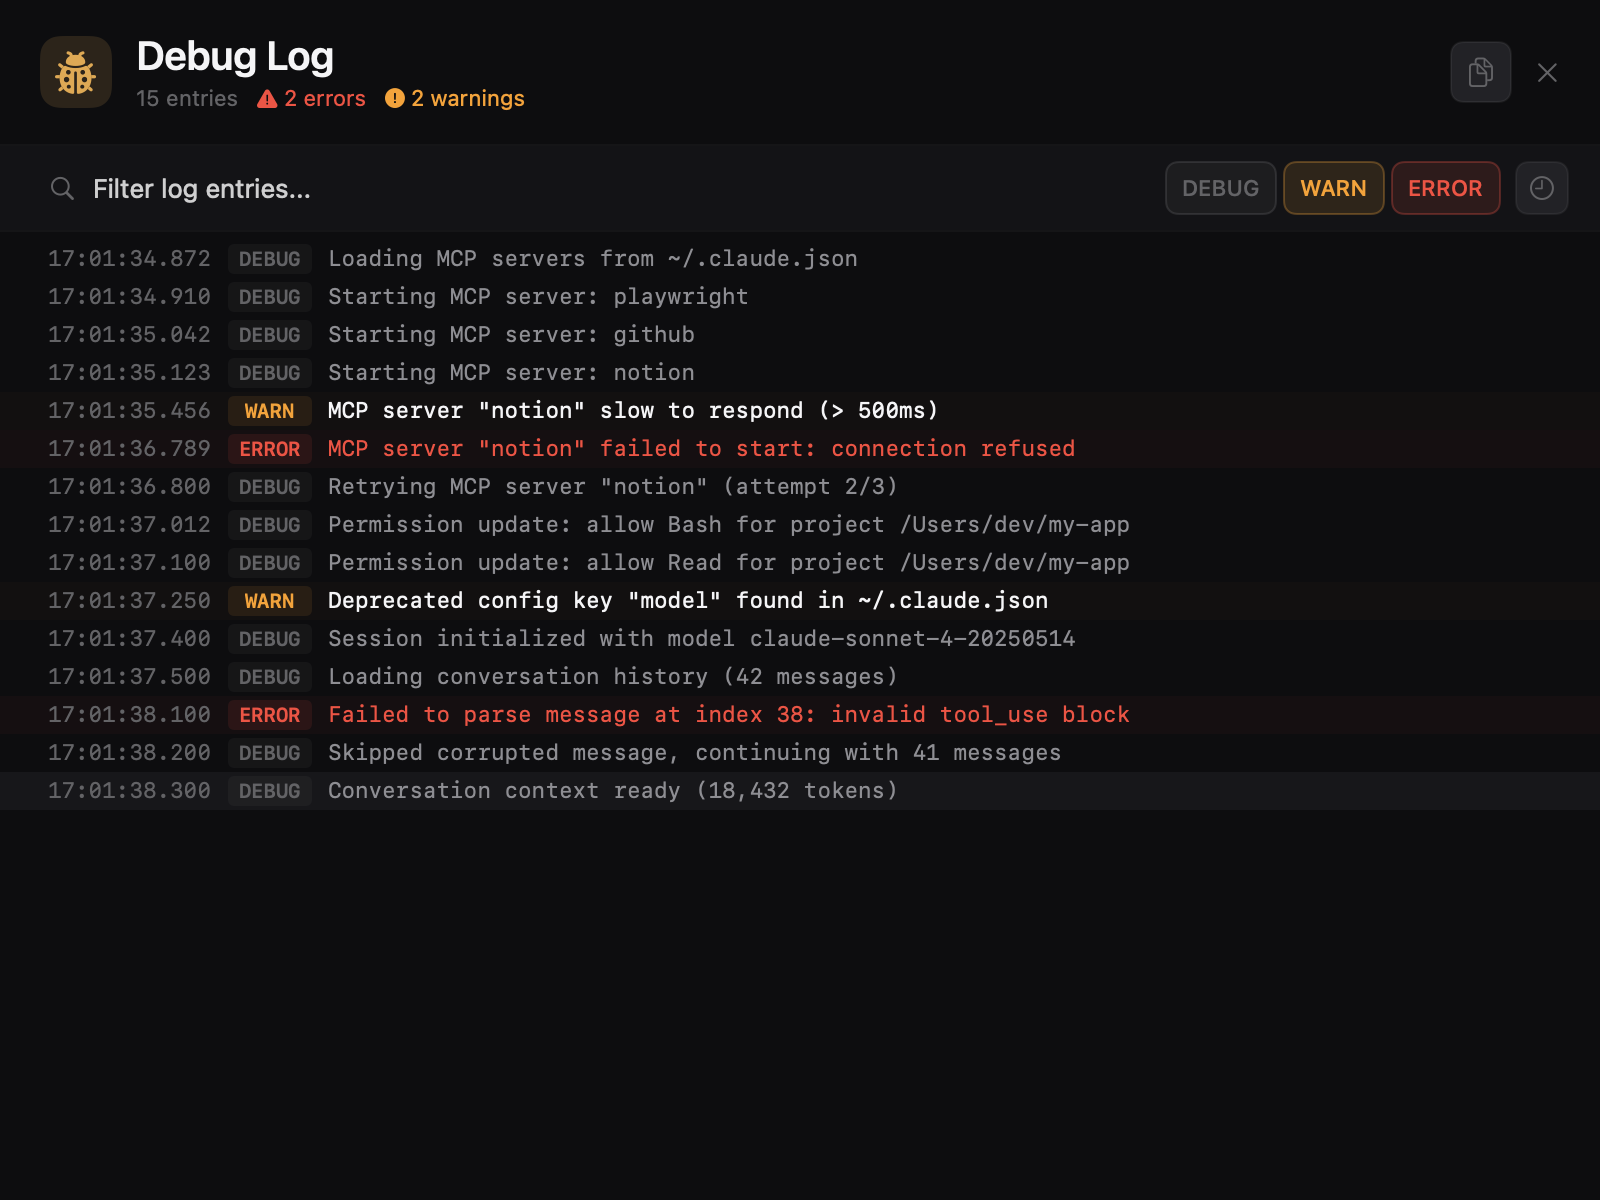
Diagnose MCP server issues, permission failures, and startup problems with the per-session debug log viewer. Color-coded log levels (DEBUG, WARN, ERROR), full-text search, level filtering, and auto-scroll to the first error. Paginated lazy loading keeps large logs smooth.
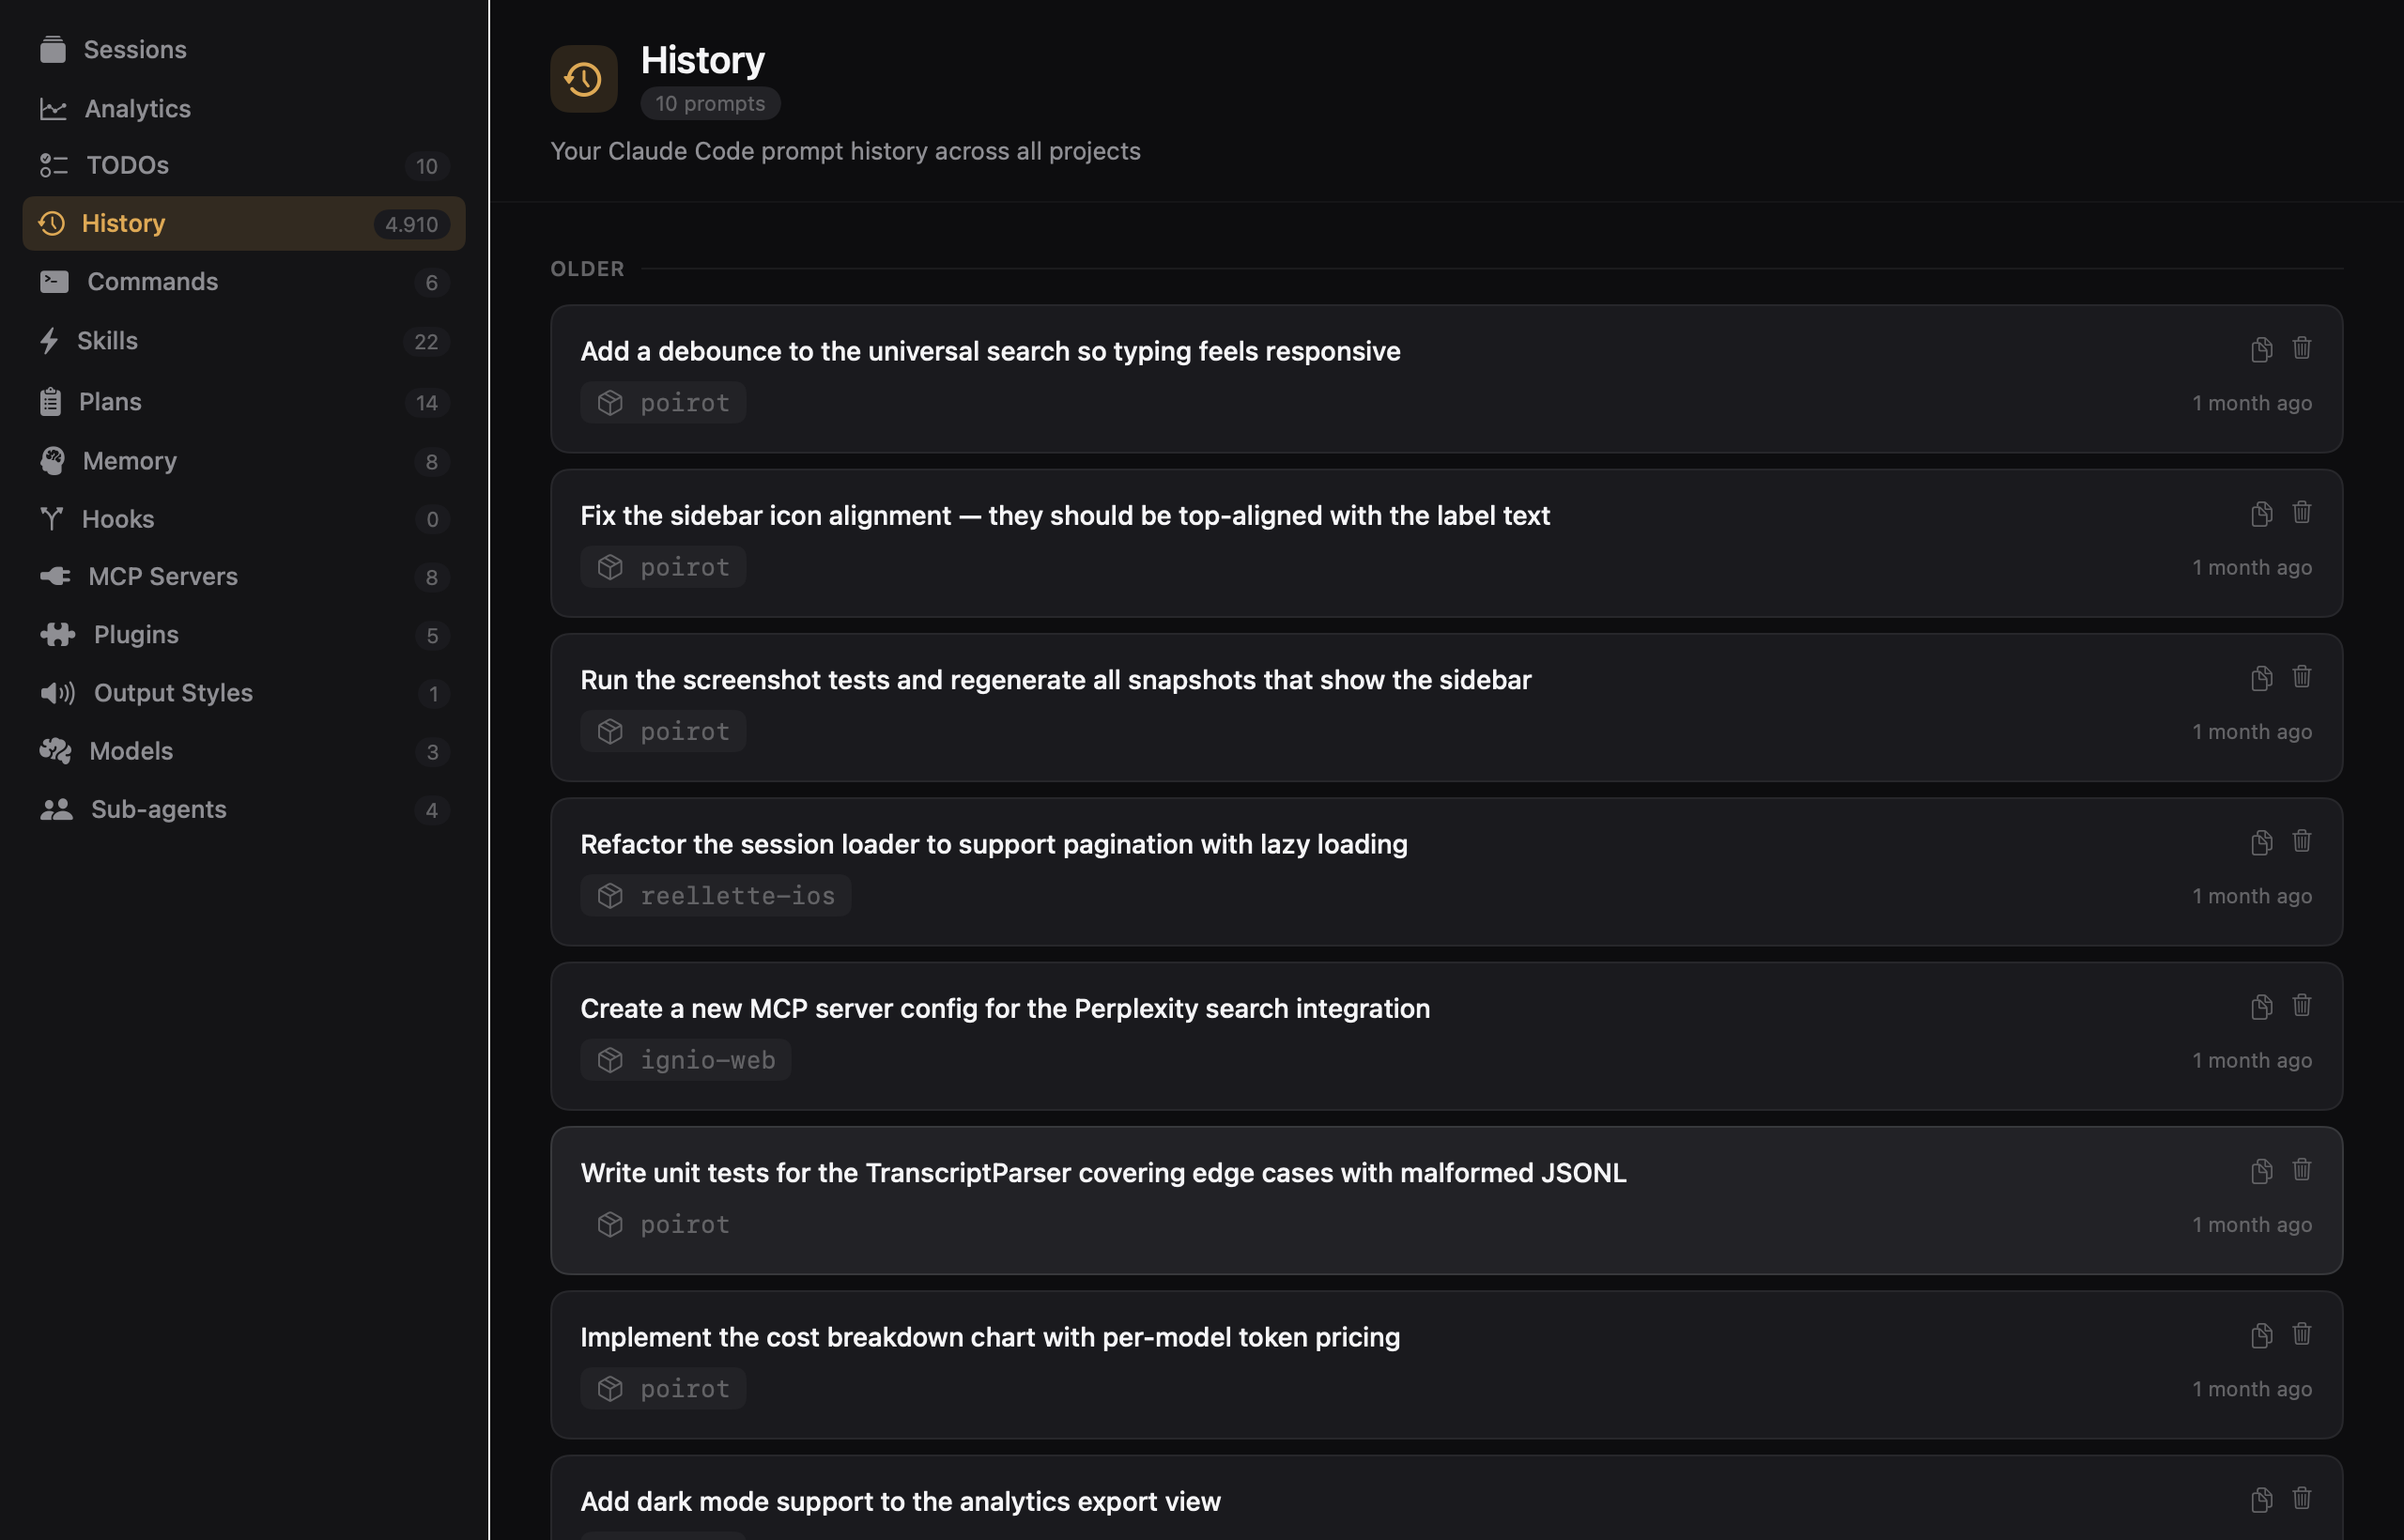
Browse your entire Claude Code input history from ~/.claude/history.jsonl. Prompts are grouped by date (Today, Yesterday, This Week, etc.), filterable by project, and searchable with full-text fuzzy matching. Copy any prompt to clipboard for reuse. Live file watching keeps the view up to date.
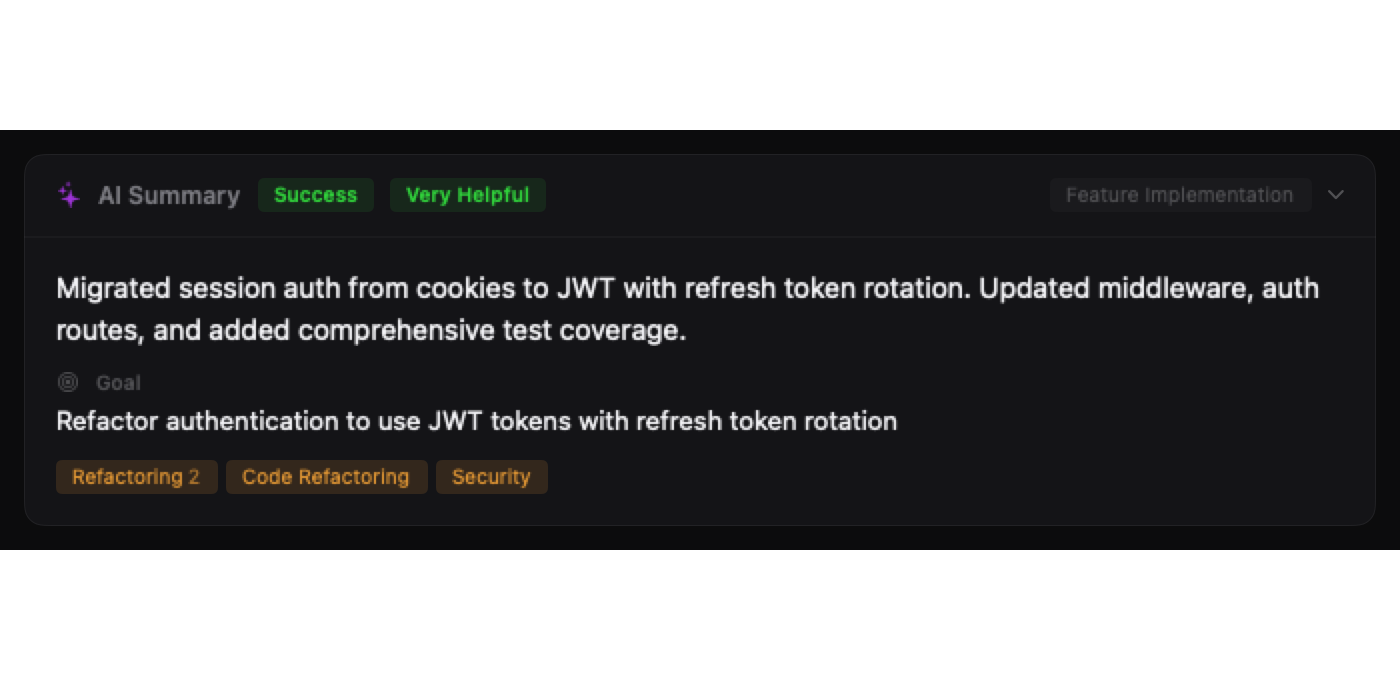
See AI-generated session analysis at the top of each session detail. A collapsible card shows the brief summary, underlying goal, outcome badge, helpfulness rating, session type, goal categories as tags, and friction indicators — all parsed from ~/.claude/usage-data/facets/. Searchable via ⌘K.
Browse auto-memory files that Claude loads into every conversation from ~/.claude/projects/<project>/memory/. Files are grouped by project with fuzzy name search, substring content search, and live file watching. MEMORY.md entrypoints are starred and sorted first.

Install Poirot in one command.
brew tap leonardocardoso/poirot && brew install --cask poirot
Requires macOS 15+